Measures (Y-Axis)
Y-axis of charts is the dependent field.
To add a field to Y-axis for a chart, click on Create Chart button on Charts tab. You will be directed to the Chart creation page.
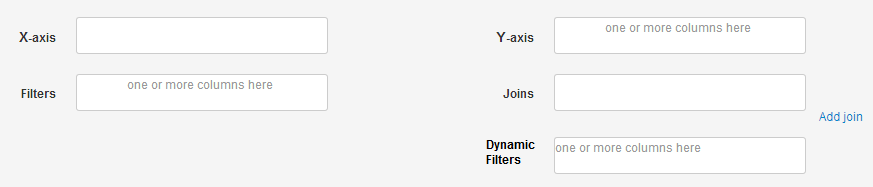
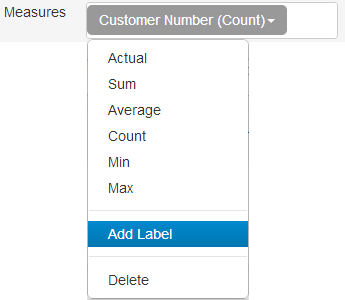
Just drag & drop a number field from the field list to the box besides the label Y-Axis. You will immediately see that a dropdown for the field has been added to the box. It shows the field name along with the default function applied to it. You can click on the dropdown to select from the other functions available. If you do so, you will see that the value of dropdown has changed to show the new function name.
If you want to delete a y-axis field, you can select the Delete option from the dropdown. You can add multiple fields as Y-axis fields. Each field appears as a series in the chart.
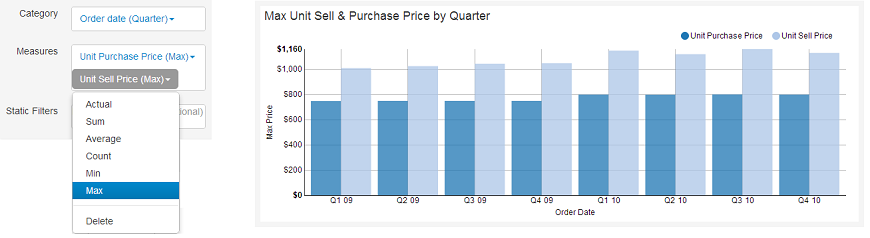
In addition to plotting the actual values present in the data, Y-Axis fields can have the following aggregation functions. These aggregations are performed for each unique value category field. To read more about X-axis fields, please refer to X-xis.
- Sum - Sum of the field
- Average - Average of the field
- Count - Count of the number of rows
- Min - Minimum value of the field
- Max - Maximum value of the field
Labels
You can customize the series name that appears on legend or column name that appears as table header by clicking on Add Label option in the dropdown, and adding a text.