How to add dynamic filters in SQL mode
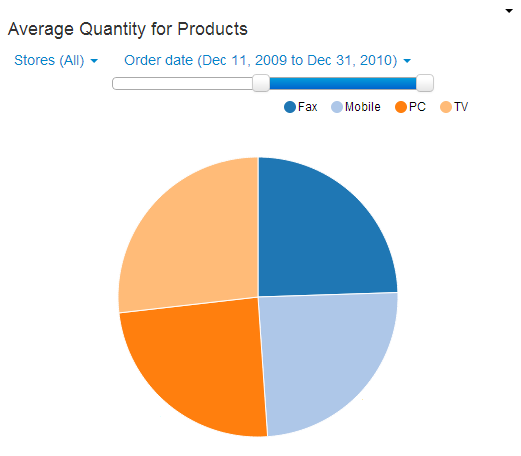
Dynamic filter is a powerful way to filter a chart in real time, just by selecting a value from a dropdown, or dragging a slider. They appear as dropdowns/sliders at the top of a chart (below the chart title) based on the filter functions that you select. It provides a very convenient way to slice & dice data in real time.
How to add a dynamic filter in SQL mode ?
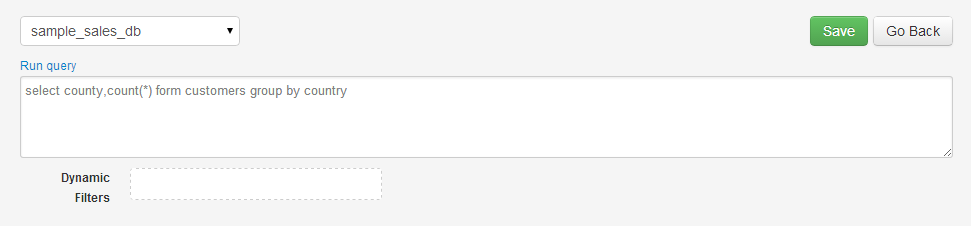
Dynamic filter can be added while creating a chart. Click on Create Chart button on your project's Charts tab and click SQL mode. You will be directed to the Chart creation page. Select database and type your SQL query
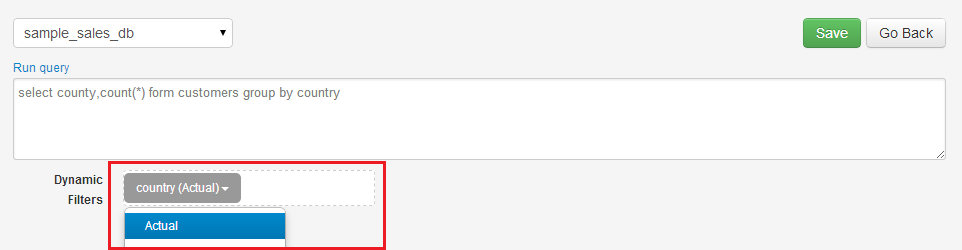
Drag & Drop a column into the Dynamic filter box as shown
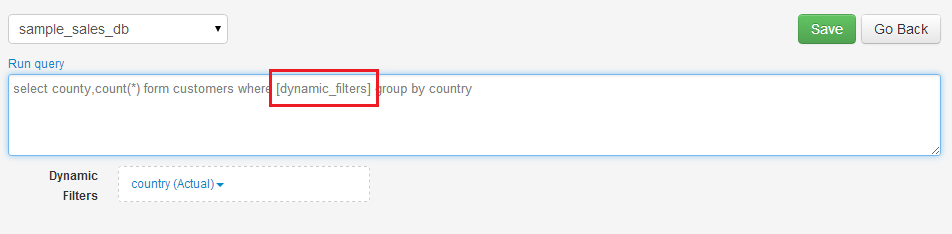
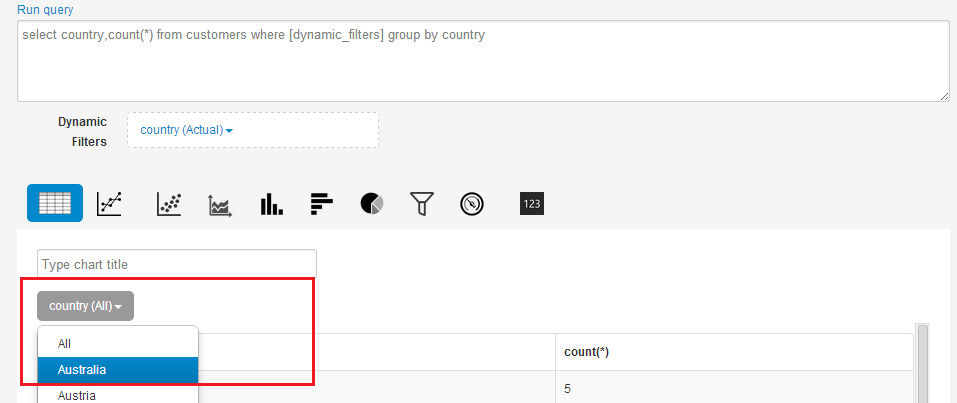
Add the keyword [dynamic_filters] in a WHERE condition of your SQL query as shown. Please note, the keyword must be present in the WHERE condition of your query.
Click Run Query. You will see the dynamic filter appear as a dropdown/slider/text field based on the option you select in Dynamic Filters box. Based on the values selected in dropdown/sliders, ubiq will automatically substitute those filter values in [dynamic_filters] during run time.
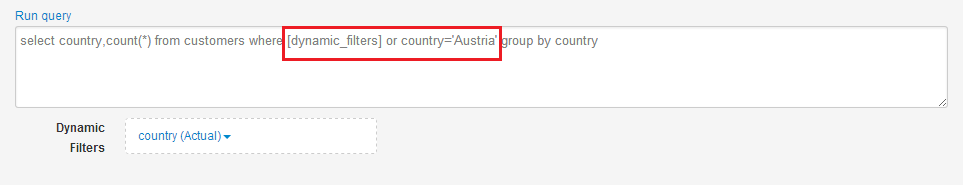
You can combine Dynamic filters with other conditions in WHERE clause using AND/OR operators
You can add multiple columns as dynamic filters for a chart. They are combined using the AND condition. These filters appear as drop downs or sliders in the actual chart.
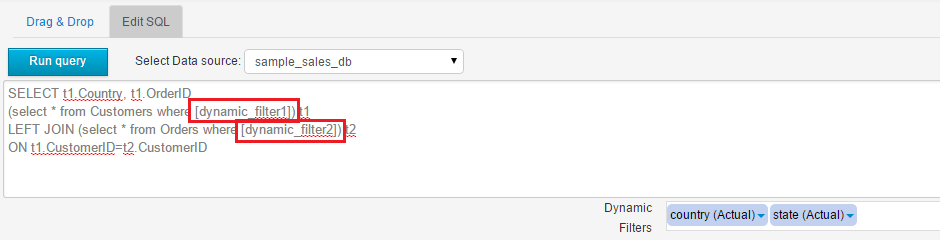
Individually apply filters at different places in your SQL
To individually apply filters at different places in your query, add the text [dynamic_filter1] in your query's where clause to apply only 1st column,[dynamic_filter2] to apply only 2nd column and so on. Suitable for complicated sub-queries or nested queries.
To individually apply ONLY filter values in your query, add the text [dynamic_filter1_value] in your query's where clause to apply only 1st column,[dynamic_filter2_value] to apply only 2nd column and so on. Suitable for complicated sub-queries or nested queries.
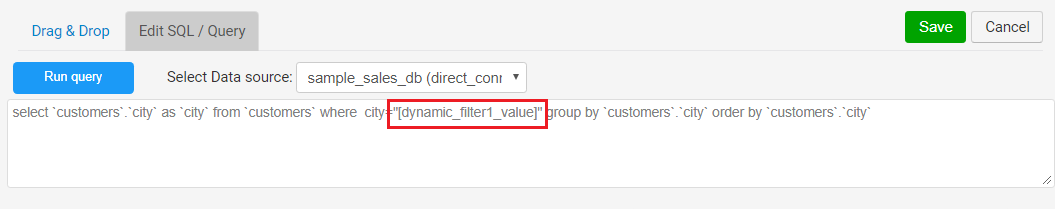
In short, when you select a value for your dynamic filter(e.g 'Apple'), then during runtime
[dynamic_filter1] becomes product.name='Apple' (includes table name and field name)
while
[dynamic_filter1_value] becomes Apple (uses only selected value)
Types of dynamic filters available
1. Text/Number filters
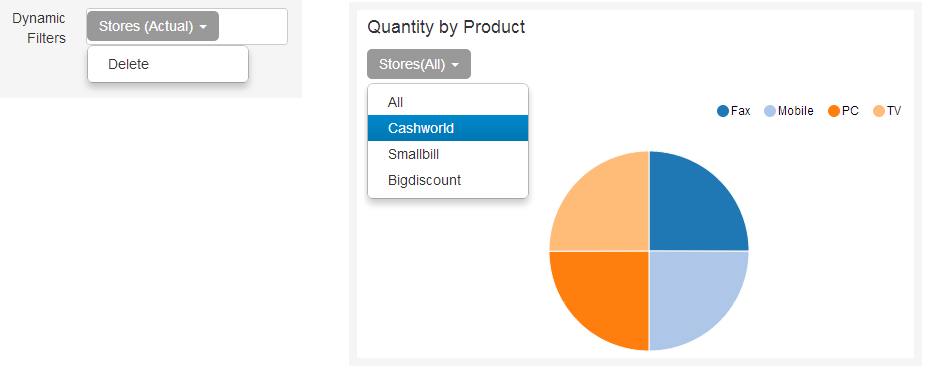
Text & Number type fields appear as dropdowns. The unique values of a field, based on your data, appear as drop down values in the actual chart.
2. Date filters
We have many powerful & intuitive functions for Date/Time type fields:
- Dropdown filters
- Slider filters
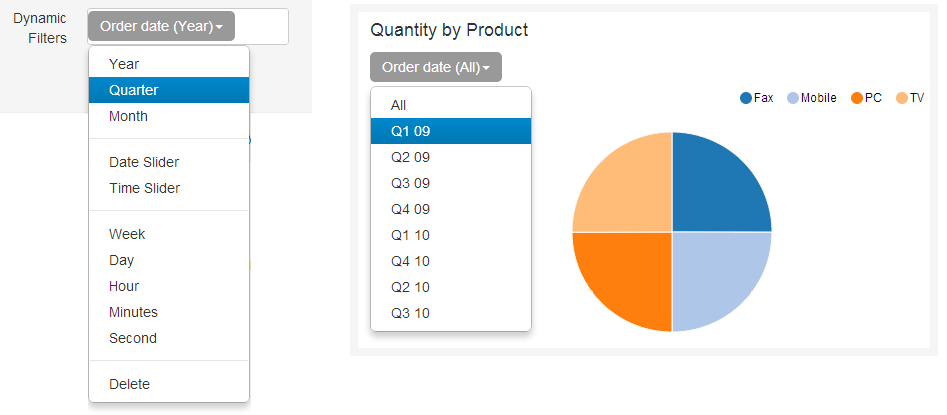
Dropdown Filter
For a dropdown filter, the dropdown in actual chart will contain unique values generated based on the function selected. E.g, if you select a year function, then the filter will list the unique values for years in your data.
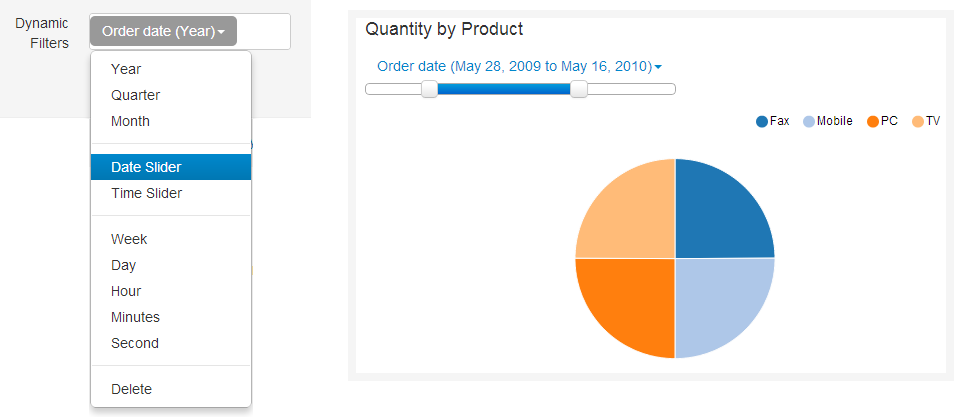
Slider Filter
For a date slider filter, the slider in the actual chart will have start & end dates based on your data. For a time slider filter, the start time will be 00:00:00 & end time will be 23:59:59.
Customize dynamic filters
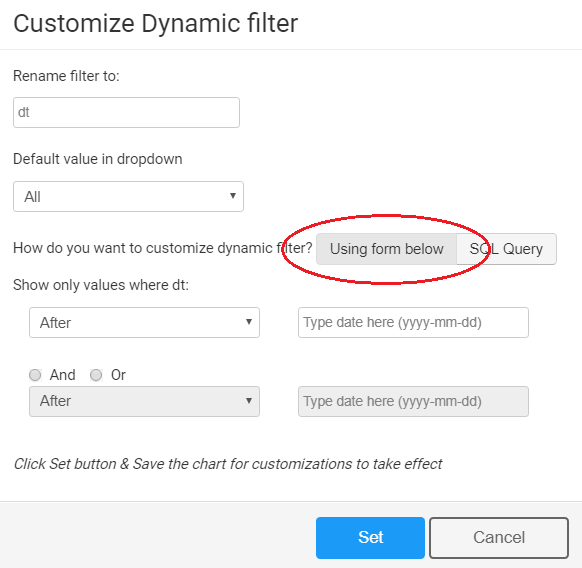
You can customize dynamic filters for charts & global dashboard filters - select default value for dropdowns, apply conditions to filter the values displayed in dropdowns & sliders, use labels to rename the filters
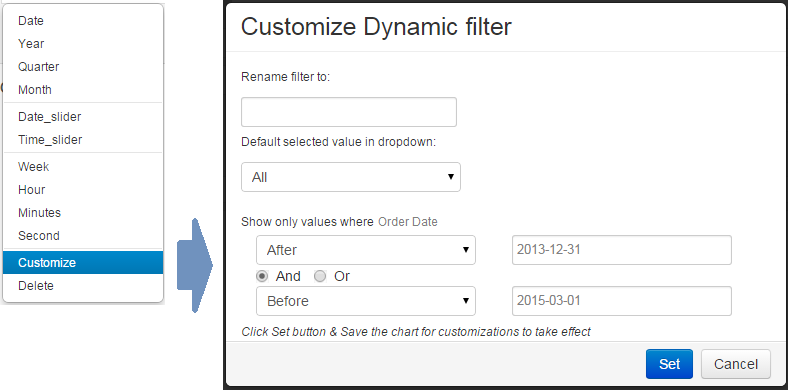
You will see a customization form for dynamic filter.
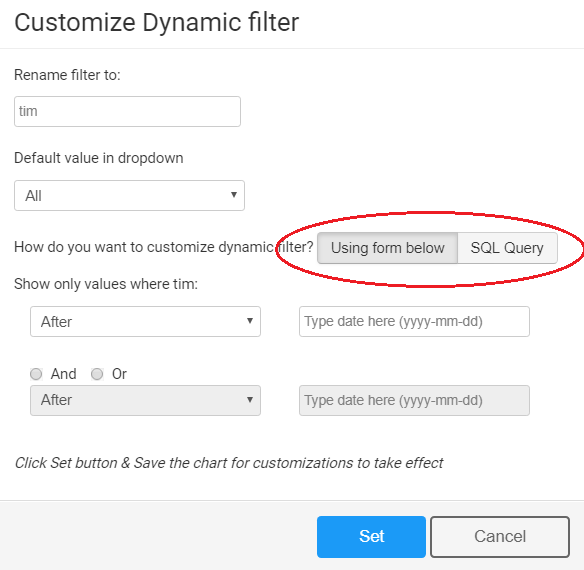
You will see the option to customize the filter via form, or via SQL.
To customize dynamic filters visually, select 'Using Form below' option and update the form as required. Click 'Set' and save the chart
To update the SQL query of dynamic filters, select the 'SQL query' option to use an SQL query to populate dynamic filter dropdows or sliders. You will see a textbox with SQL query for your dynamic filter.
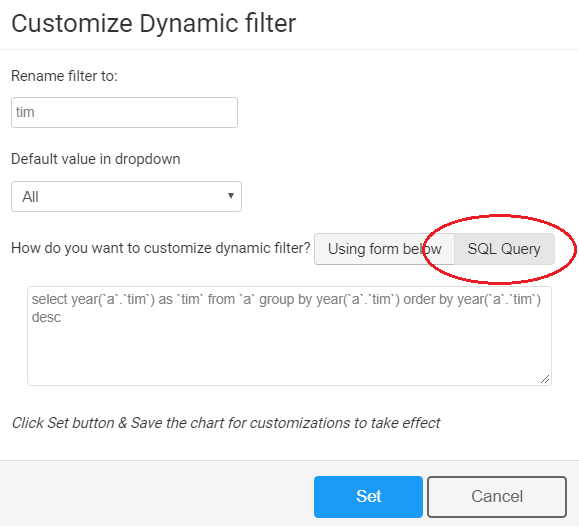
Update the query and click 'Set'. Then save the chart.
Please note: For dropdown menu filters, select only 1 column in your SQL query.
Please note, if a filter value is not present for a dashboard chart, it will not populate the chart with any data, when you select a filter value.