Business Intelligence
Bring reporting, dashboards, visual analysis and secure sharing together in one web-based BI environment.
Explore Business IntelligenceUbiq is web-based business intelligence software that helps teams analyze data, create interactive dashboards and reports, and share useful insights without building a reporting system from scratch.
Trusted by businesses around the world






Start with the part of Ubiq that matches what you need to accomplish.
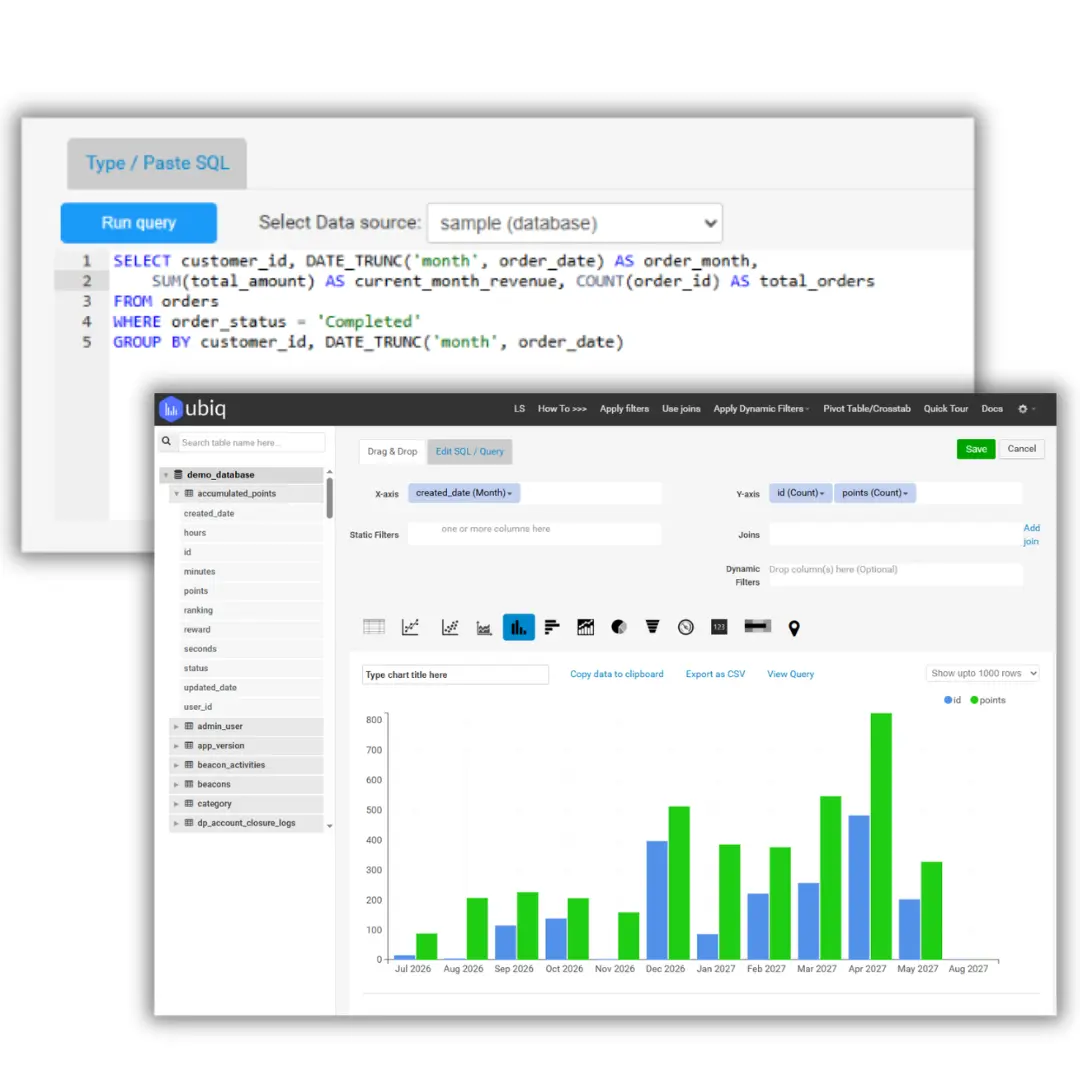
Business users can create useful reports through a visual workflow, while analysts and developers can work directly with SQL for more advanced reporting logic.
Select data, group information, apply filters and create visualizations without requiring every user to write queries.
Use SQL for joins, nested queries, aggregations, formulae and other reporting logic that needs precise control.
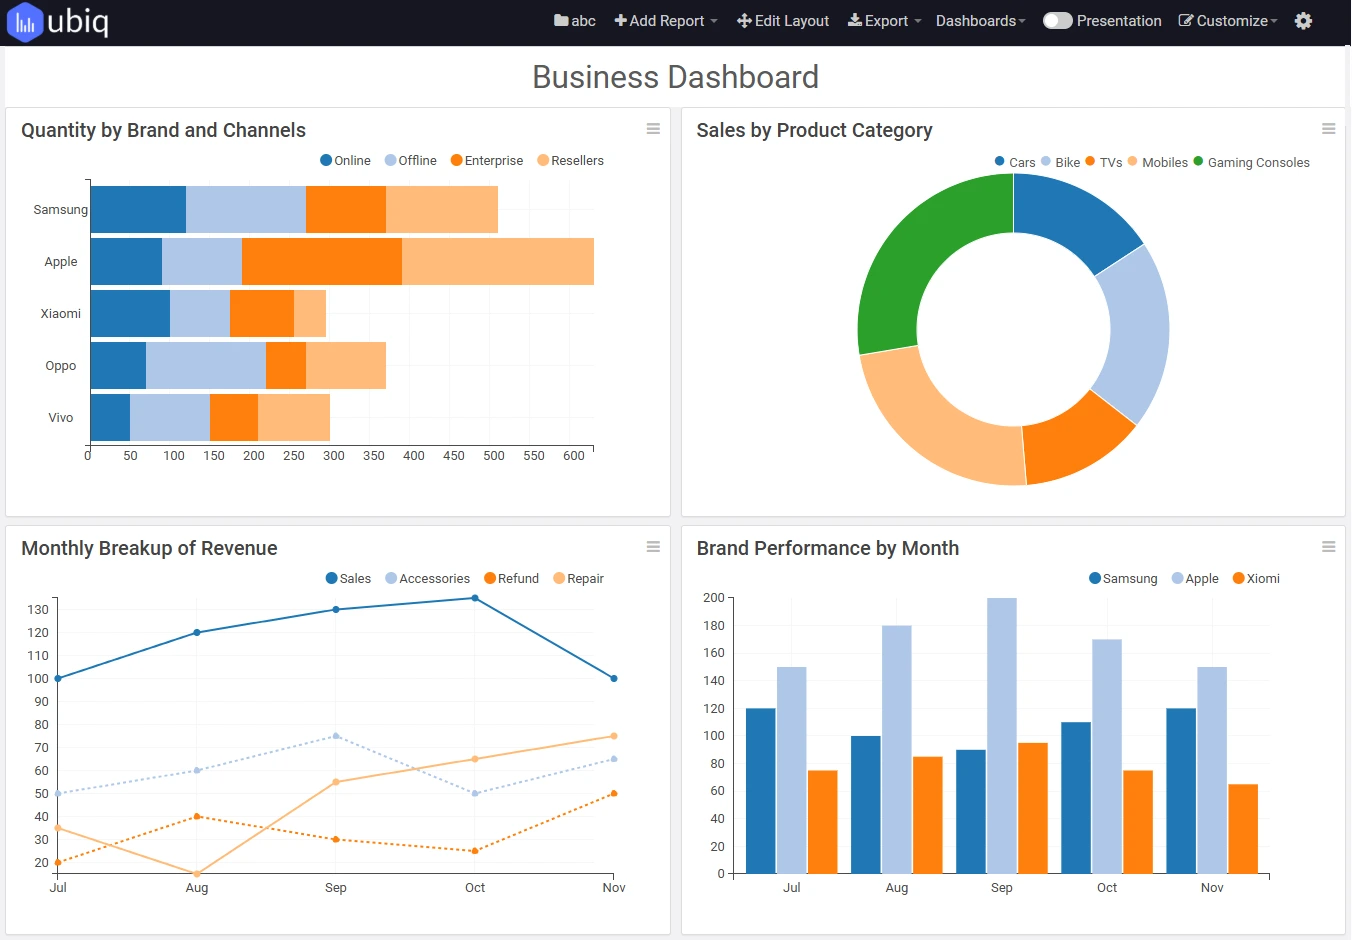
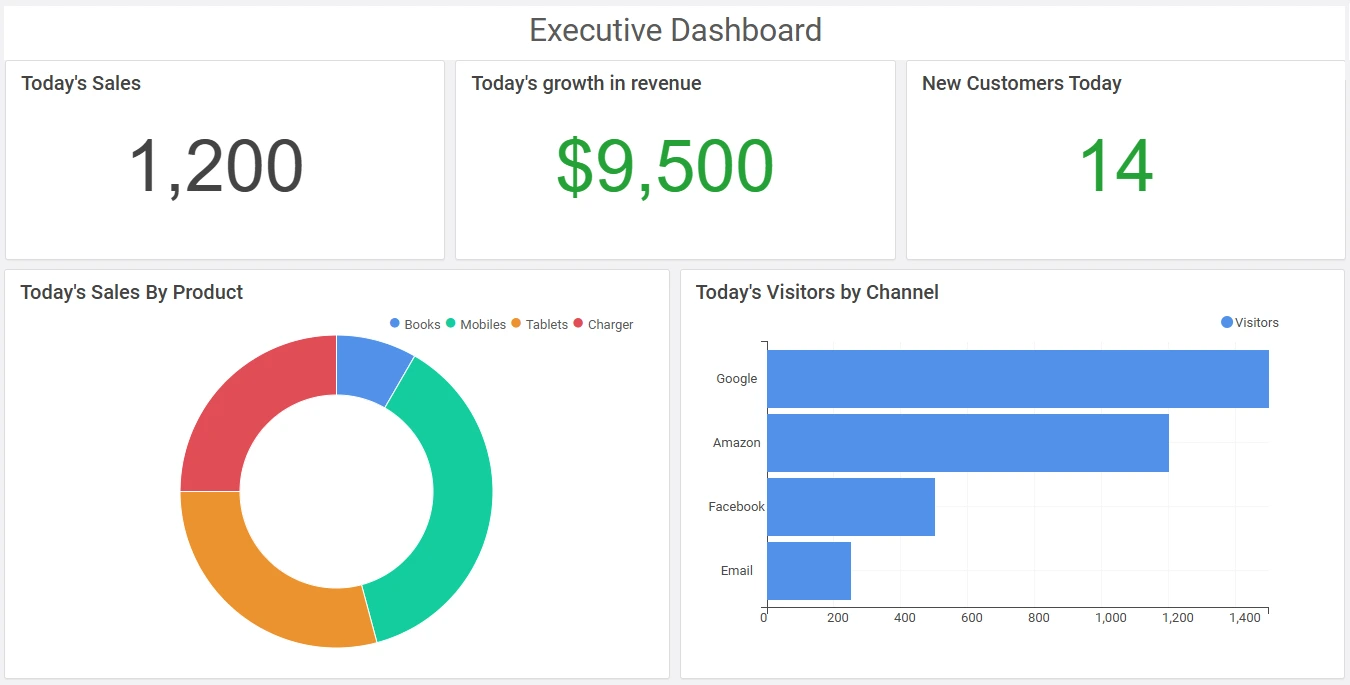
Combine charts, tables, metrics and filters into dashboards that help teams monitor current performance and investigate the numbers behind it.
Go beyond static exports. Build interactive business reports that users can filter, sort and drill into when they need more detail.
Use charts, tables, cross-tabs, calculations, parameterized queries, user inputs and other reporting tools to create the right view for operational, analytical or management reporting.
Explore Reporting Software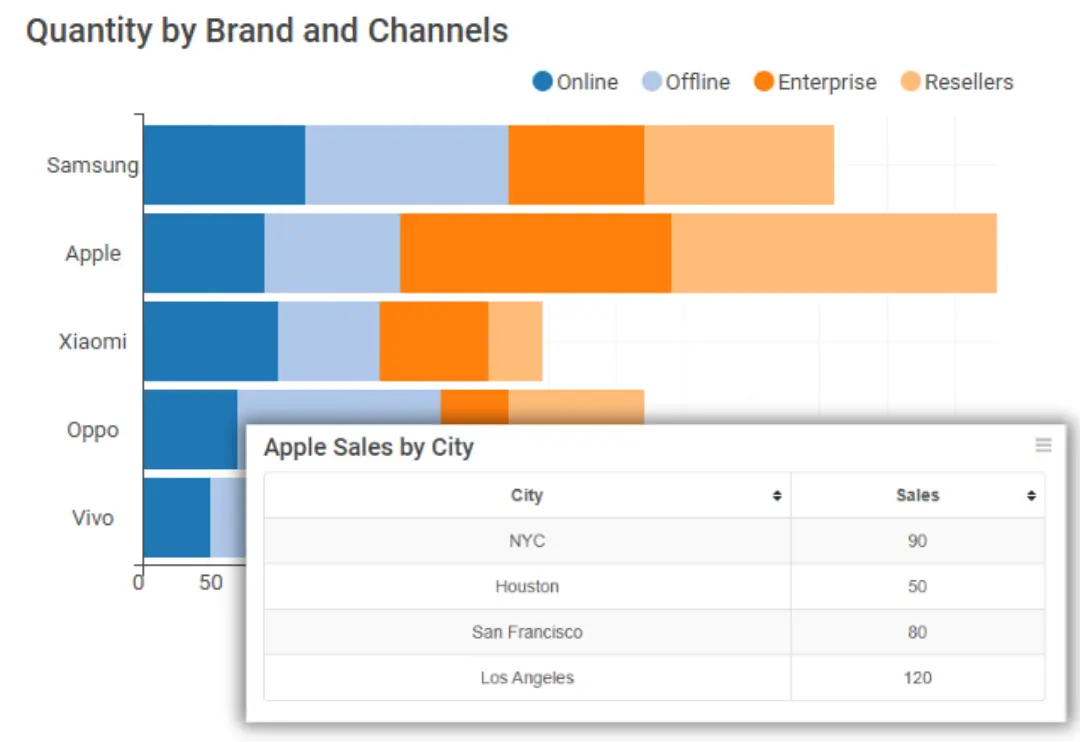
Connect Ubiq to supported relational databases and build reports from local, remote, cloud or private-network data.
Bring related information together when reporting requirements span more than one supported database.
Explore BI PlatformSupport reporting workflows for compatible local, remote, cloud and private-network database environments.
A straightforward workflow for turning business data into information your team can use.
Connect a supported database to Ubiq.
Visualize, filter, calculate and drill into the data.
Give your team access or export information when needed.
Track revenue, orders, customers, conversion and sales performance.
Analyze acquisition, campaigns, signups, customers and funnel metrics.
Monitor activity, transactions, service metrics and operating KPIs.
Give decision-makers an overview of KPIs with supporting detail available.
Build common reports visually without requiring everyone to learn SQL.
Use SQL, calculations and advanced query logic when reports need more control.
Build, view and share reports through a browser instead of distributing desktop files.
Use automatic refresh for dashboards and reports that need current information.
Give colleagues access to shared information while controlling reporting permissions.
Export supported reports for offline use while keeping the browser version as a shared source.
“Several departments use Ubiq... Looks like all departments use Ubiq. It’s our main analytics tool.”

“Ubiq has given us instant access to all our data. The charts are very smart and work very well for us.”

“Ubiq is a very very good and useful product. It easily saves 10x the time needed to write a query and filters.”

Create interactive dashboards and reports, analyze your data and give your team a clearer view of the business.