Visual Analytics made easy
-
✓ Easily create reports & dashboards
-
✓ Visualize data using drag & drop
-
✓ Apply powerful filters & functions
-
✓ Share reports with your team
-
✓ Supports local, remote or cloud data
Try ubiq for free!

Ubiq is a powerful web based visual analytics software and data visualization tool. It helps you visualize your data in minutes using drag & drop, share results & insights of data analysis using interactive data visualizations and dashboards. It allows you to explore and analyze data without programming. Enable better decision making.
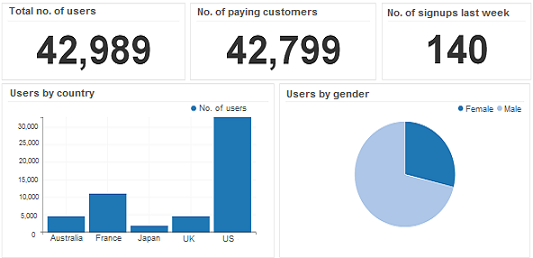
See how easy it is

Visually analyze your data using drag & drop. Create stunning data visualizations, charts & graphs in minutes. Ubiq helps you visualize data in interactive online dashboards. Customize labels, tooltips, formatting, etc of data visualizations using point and click. Ubiq is a powerful visual analytics software to quickly analyze & visualize your data and share insights using dashboards. No need to learn programming or API. Easily turn data into actionable information and meaningful insights that you can share with your team.
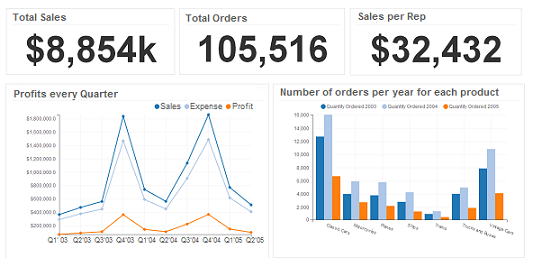
Visualize & analyze data, spot trends and patterns through visual analysis in real time. Auto refresh feature automatically updates visualization dashboards, charts & graphs. No need for manual changes. Ubiq visual analytics tool provides powerful visualizations & analytical functions. Dynamically filter or slice & dice data in real time. Ubiq simplifies data exploration & visualization. Discover visual insights in seconds & enable faster decision making.

Access all your data from one place no matter where your data is located. No need to move your data around. Perform visual analysis on MySQL, MariaDB, Amazon RDS data. More data sources to be added soon. Visualize multiple datasets to discover key insights. Apply analytics functions to your data directly from your browser. Our visual dashboards enable you to analyze and explore data from a single location using an easy-to-use and interactive interface. Easily interpret results of data analysis and share it with your team.
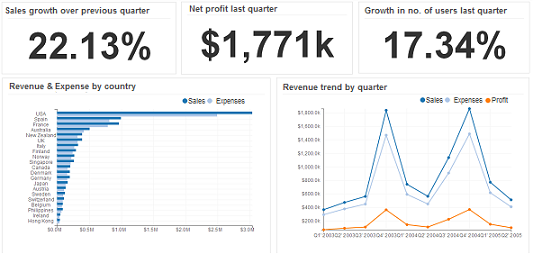
Visual analytics is becoming the fastest way for people to understand and explore data. Ubiq helps you visualize data for all types of businesses like Ecommerce, Mobile Apps, SaaS, Reporting Agencies, IT firms, etc. It lets you automate data analysis & reporting for all areas of your business like Sales, Operations, Marketing, etc. Create beautiful, interactive visual dashboards & reports like Sales dashboard, Executive dashboards, Management reports, etc. You can even visualize your website or app database, or third party applications like Magento, Wordpress, etc. which use MySQL database.
Explore, visualize & analyze data across various platforms. Ubiq is a data visualization software for Mac, Linux & Windows. It's highly customizable, works in all major browsers & tablet devices. It lets you create visualizations for data and share visual insights on multiple platforms and devices. Increase productivity of your business, clients & partners. It helps you design reports once and view them anywhere.
Signup and immediately start analyzing data visually. Usability, flexibility and low time to market make ubiq a good choice for data analysis & visualization. Its self serve nature and customization capabilities, wide range of visualizations and powerful analytical functions make it very easy to visually analyze data and share results with your team. Quickly visualize your data using drag & drop. Customize visualizations & dashboards using point and click. Enable fast decision making. It's a web based application for visualizing data flexibly and easily.


No need to enable remote access or open ports. Securely connect to MySQL on AWS over SSH. For intranet or private network, ubiq ensures the data doesn't leave your network. Ubiq agent sits on your laptop & connects to your databases with read only access. Assign create or view permissions to your team mates. Securely perform visual analytics for your data.
Some of our valuable customers across various countries