Easy Dashboard Reporting Software
-
✓ Create insightful dashboards
-
✓ Track KPIs & Metrics in real-time
-
✓ Fully customize dashboards
-
✓ Access dashboards on any device
-
✓ Share dashboards with others
Try ubiq for free!

Ubiq Dashboard reporting software is easy-to-use, powerful and affordable. You can quickly create interactive dashboards for your business. Access business dashboards using web browser and securely share them with others. Export dashboards in multiple formats. Easily create custom dashboards for everyone in your organization. Managers and executives can monitor business metrics using real-time dashboards and improve business performance. Easily analyze your business data, create online dashboards to track key business information without programming.
See how easy it is

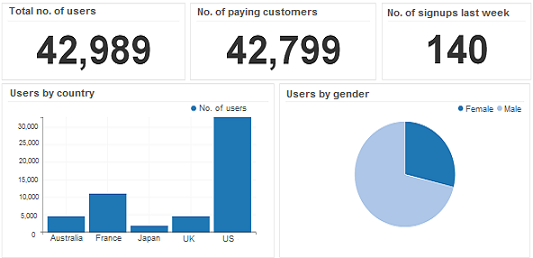
Ubiq dashboard reporting software helps you build dashboards for your business using an intuitive, easy-to-use interface. This helps users quickly track the important KPIs and performance metrics for their business in interactive dashboards. It enables even business users or non-technical users to easily create dashboards using a drag and drop interface, without depending on IT. Ubiq is a feature-rich dashboard reporting tool. It allows users to create, understand and share dashboards, on their own. Being web-based tool, Ubiq enables users to easily create and view dashboards simply using web browser. These dashboards help users to get at-a-glance status of their business. They help easily transform data into useful information.
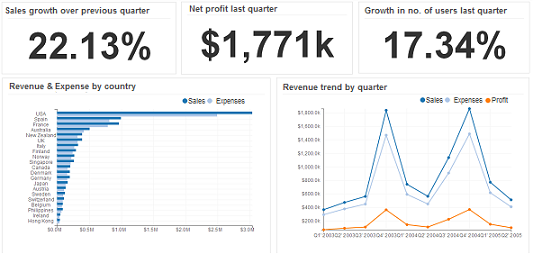
Ubiq dashboard reporting tool helps users build real-time dashboards for their business. It transforms data into insights, in real-time. Ubiq dashboards feed from real-time data, allowing everyone in your organization to see the latest numbers, and always access the freshest insights. Ubiq's online dashboards make it easy for users to collaborate, and share insights with others. This ensures everyone is up-to-date and on the same page. Ubiq Dashboards update in real time to show the latest information. Users can track key performance indicators and metrics of their business as they occur. Ubiq allows users to make well-informed decisions, faster. It helps them spot trends, opportunities and issues as soon as possible and respond immediately.

Ubiq Dashboard Reporting Software provides tons of features to fully customize dashboards. Users can select charts, colors and dashboard layout with a few clicks. They can choose the graphs, charts, info graphics and maps they want to display in your dashboards. Ubiq allows you to easily customize the dashboard look and feel, color theme, and layout to highlight insights better. Customize dashboards for each user to deliver personalized insights. Every organization has different kinds of users who need specific type of dashboards. Ubiq provides tons of customization features and rich formatting options to create dashboards for every user - from Executives to Data Analysts - in your organization. Customize your dashboards to deliver better insights, faster. Get more value from data instantly.
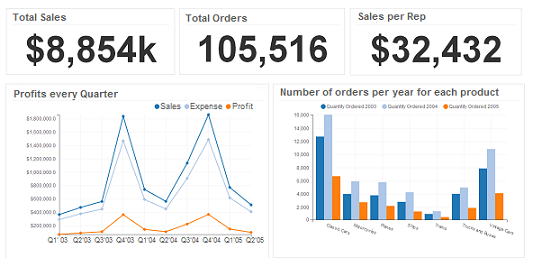
Create business dashboards with advanced charts & graphs. Ubiq provides an extensive list of advanced visualizations to clearly present your data and communicate your insights. It offers a variety of advanced charts, visualizations, graphs & maps that users can use to add value to their dashboards. Choose from a wide range of visualization and formatting options to build visually compelling and insightful dashboards. Use a variety of graphs, charts and visualizations to create insightful dashboards. With advanced reporting capabilities such as filter, search & drill downs, users can easily view data in greater detail. In addition to the basic chart types, ubiq provides many advanced charting options such as pivot tables, cross-tabs, combination charts and even maps. Easily visualize data for your website, app or other corporate data sources. Ubiq is a flexible dashboard reporting tool for your team, clients and partners. Track all key metrics and trends in interactive online dashboards.
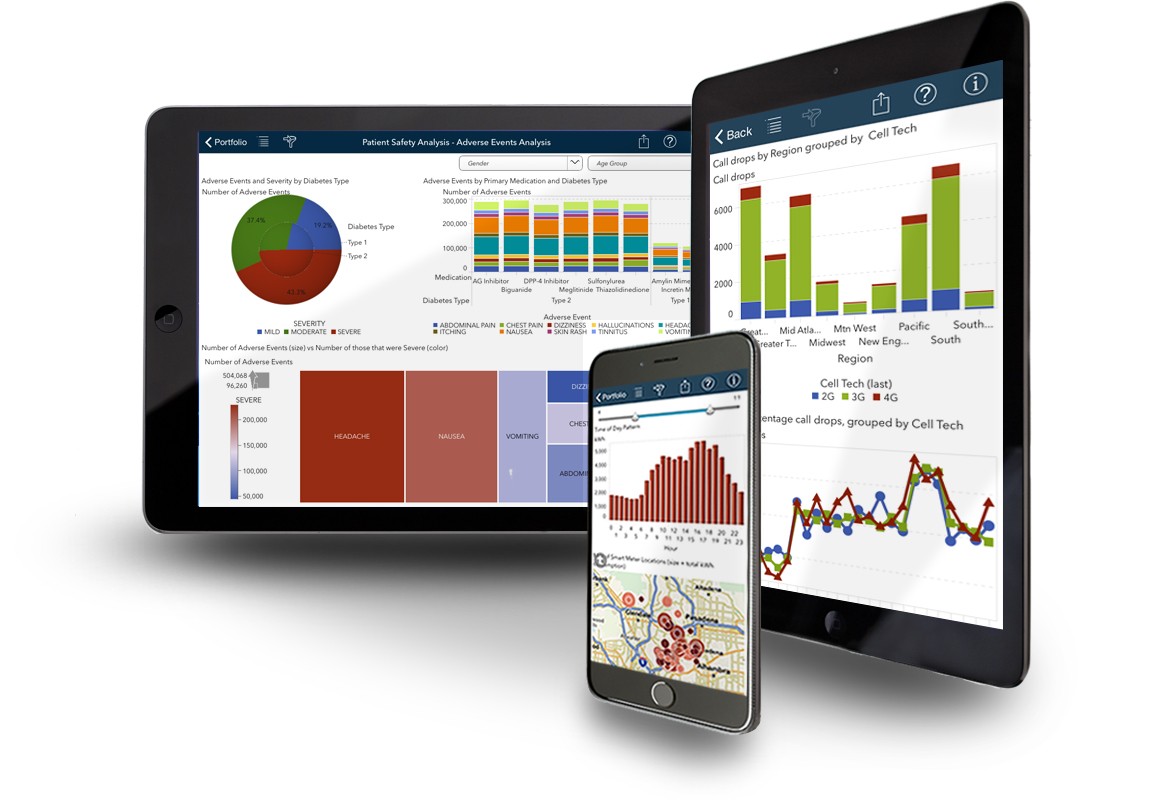
Access business dashboards on mobile, tablets & PC. Get insights on any device. Ubiq is a responsive dashboard reporting software that automatically adapts to desktop, tablet and mobile phones. Being web-based, users can view dashboards on any internet enabled device. Take your business dashboards with you everywhere. Monitor KPIs & metrics from any device, anywhere, any time. This enables everyone in your team to access critical information wherever they are, whenever they want. It improves collaboration and decision-making. Managers and Executives can view dashboards on mobile & tablets while Data Analysts & Marketers can create & share them using their workstations. Get the right information to the right people at the right time. Ubiq Dashboard Reporting Tools work with data on any platform. Easily create and share online dashboards across diverse systems. Suitable for individuals and teams who work on data across different systems. A Cross platform tool for your business.
Ubiq Dashboard Reporting Tool makes it easy to share dashboards with others. You can easily provide access permission to others and share dashboards simply using a URL. You can also publish dashboards in multiple formats or schedule them to be automatically mailed periodically. Ubiq enables you to easily share dashboards and reports with others. This helps you share insights and collaborate with your team. From interactive dashboards to beautiful reports, Ubiq provides a simple way to manage, analyze and visualize all your data. Build excellent dashboards at a fraction of time & cost it takes with other solutions. Designed for users who need to get at-a-glance status of their business but have little or no prior experience with business intelligence and dashboards. Web based reporting makes it convenient to build, change and manage reports for your business.

Business Dashboard Software provide a web-based reporting tool that enables you to rapidly develop custom, interactive dashboards for your business. It acts as a central reporting solution for your business, where users can explore, analyze & visualize data across the organization. Ubiq offers a powerful suite of dashboard reporting tools that allow you to create dashboards in minutes, and monitor up-to-date information about every area of your business. Our dashboard software lets users create their own dashboards, on-the-fly, using an intuitive drag and drop interface. This enables even non-technical users to answer business questions on their own. Ubiq comes with more than 30 powerful data visualizations including interactive charts, gauges, maps, and more. This allows you to always use the right data visualization for the information you want to display, and highlight insights with your dashboard designs. By connecting to live data, your dashboards always show the latest insights. They can be automatically refreshed without manual intervention. Our dashboard software enables users to quickly access information they need without depending on IT. Drag and drop columns to easily create your own dashboard, and save it for future reference. You can also share dashboards with others or export the results to Excel for further analysis. Ubiq is one of the most powerful, flexible dashboard software available.
Some of our valuable customers across various countries