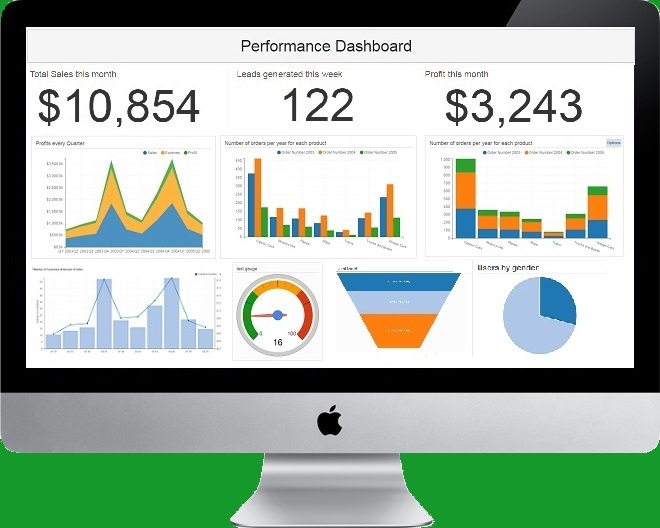
Create rich, professional-looking reports in minutes.

Easy to setup. Create your first report in less than 10 minutes. Even business users can use it without depending on IT.

Customize every aspect of your reports such as report layout, chart colors & formatting, with just a few clicks. Create highly customized charts and reports for every aspect of your business such as Sales, Marketing, Operations, HR, IT.

Schedule reports to be automatically generated & emailed to your team or clients. Ensure everyone is on the same page and up-to-date about your business.

Your data to create interactive reports. No SQL knowledge needed. Easily explore, analyze and visualize your data directly from your browser.

Powerful functions to select, sort, filter, group & summarize data. Slice & dice data on the fly. Gain insights from your data, spot patterns and outliers.

Export reports as PDF, PNG, CSV. Share data-rich, professional-looking charts and dashboards with your team and clients.

Choose from a wide range of visualization options. Analyze data visually. Present it in multiple ways to intuitively communicate insights.

Access reports from PC, tablets & phones. They adapt to your device to provide an amazing user experience. Access critical information about your business performance, anywhere, anytime, without any hassle.
Share online reports with others by sharing URLs. Collaboratively create charts and dashboards, gain insights and make decisions.

Build complex queries without writing any code. Rich controls let you design pixel-perfect reports. From simple to complex, create rich reports for every business function, every level of your organization.
Easily convert data into insights. No need to wait for IT. Save days or weeks spent in creating reports.
Ubiq is a Reporting solution that anyone can use. See for yourself!
