How to create Map Chart
Ubiq provides 5 different maps to help you plot data - World Map, US Map, Africa Map, Asia Map, Europe Map. You can plot data on map using drag & drop or sql query
Using Drag & Drop
Drop fields only in Y-axis box, in the order longitude,latitude,column1, column2, etc. Select actual function for longitude, latitude. Column1, column2, etc. are fields you want to measure(e.g sales, customers)

Using SQL:
Select fields in order longitude,latitude,column1, column2, etc. Column1, column2, etc. are fields you want to measure(e.g sales, customers)

Once you obtain the data, select the map you want to plot your data on, from the dropdown.
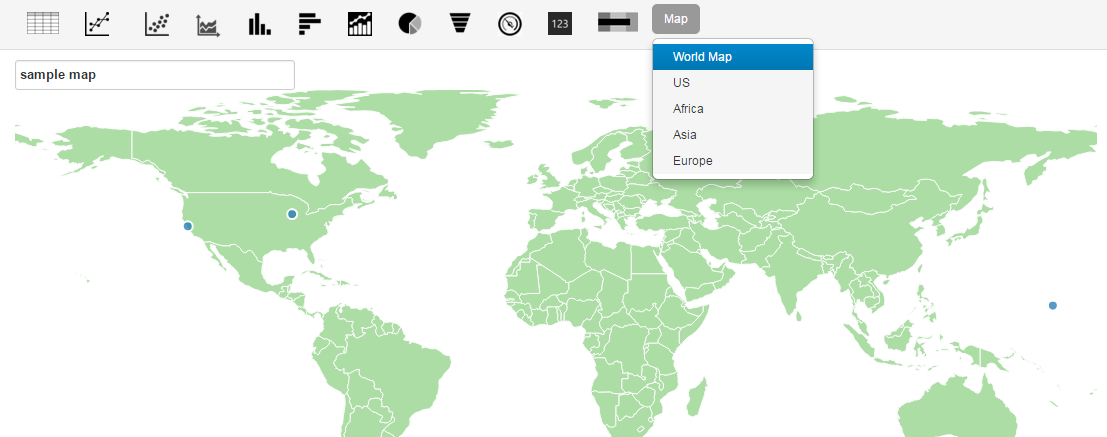
You can hover over the blue circles on the map to see values that you are measuring (e.g. sales, customers, etc) for that location.
Double click on map to Zoom in. Shift key + Double Click to Zoom out