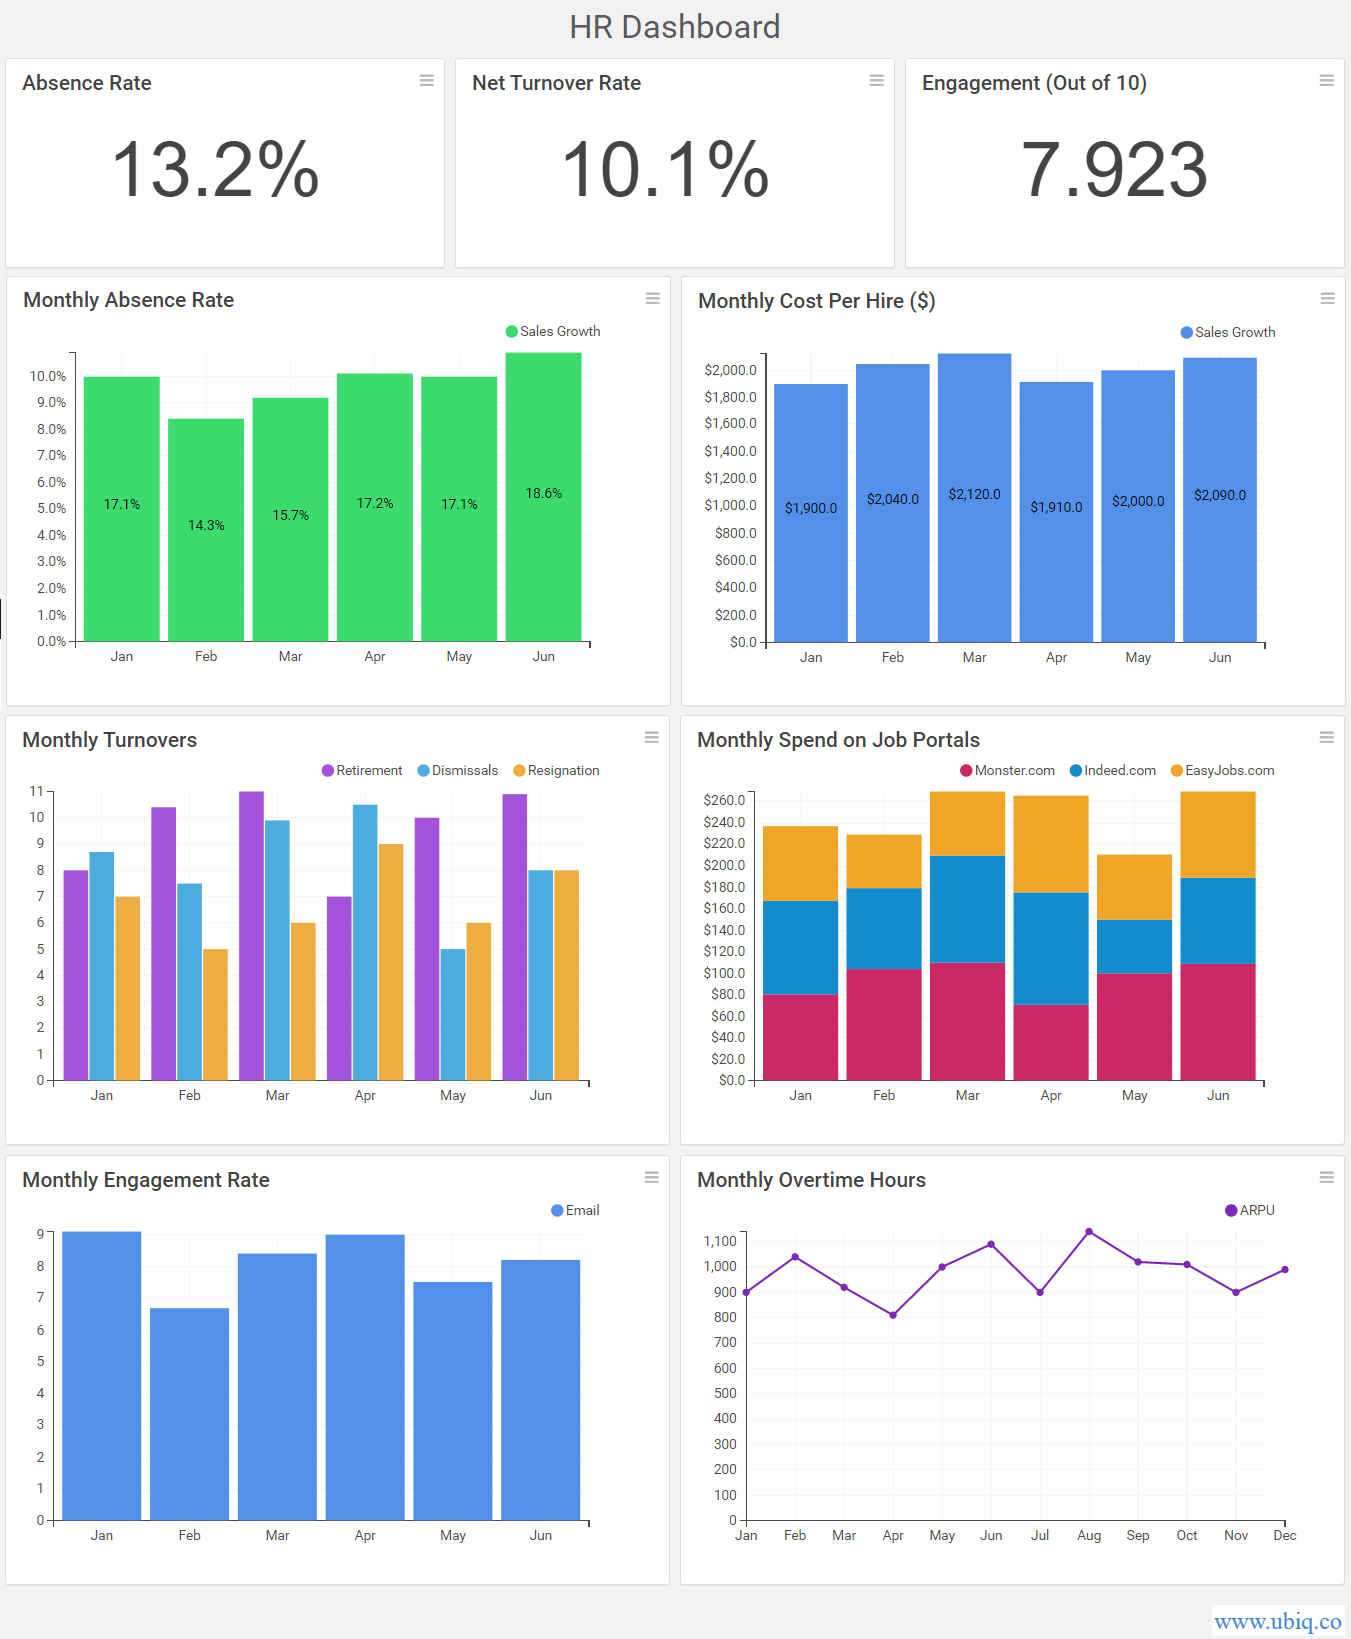
HR Dashboards & Reports make it easy to get at-a-glance status of HR performance about various HR processes in your organization. They enable HR executives to make sure that the various HR systems in your organization are working smoothly, identify and fix issues as quickly as possible.
HR Dashboards & Reports : Benefits, Examples, KPIs, Metrics
What is an HR Dashboard
HR Dashboard is a visual presentation of the key HR performance indicators and metrics about your business, along with relevant trends, comparisons and distributions.
HR dashboards and reports are meant for HR managers and team leads to regularly monitor HR performance of their organization, identify issues upfront and resolve them quickly.
HR dashboards automatically collect, analyze, and report information from the various HR systems and processes. In fact, some of them even automatically refresh at regular intervals to update their information.
HR Reports are nothing but static versions of HR dashboards. While HR dashboards show live data that automatically updates at regular intervals, HR reports are snapshots of HR performance. In many cases, HR reports are PDF/Excel exports of HR dashboards.
Bonus Read : Best Marketing Dashboard Examples & Templates
What are the Benefits of HR Dashboard & Reports
Here are the key benefits of HR dashboards and reports. They:
- Offer a single point of access to all HR performance information
- Gather and report data from diverse sources
- Give a visual understanding of HR performance
- Automatically deliver scheduled email reports to key stakeholders
- Give at-a-glance status of key HR stats
- Are accessible anywhere, anytime, on any device
Bonus Read : Financial Dashboards & Reports – Examples & Templates
How to Create HR Dashboard
Here are the steps to create HR dashboards and reports.
1. Understand Your Target Audience
It is important to clearly identify the end users of your HR dashboards and reports. They may be HR managers and executives, recruitment managers, head hunters, etc. Different people look for different kinds of information. For example, an HR manager might be interested in the overall big picture, while recruitment managers might be interested in analyzing individual recruitment campaigns.
2. Identify HR KPIs and Metrics
Next, you need to understand the HR performance metrics and KPIs that you need to display on your HR dashboards and reports. Conduct meetings with key personnel, decision makers and stakeholders in your HR department to understand their key business goals and objectives. Also, determine the HR KPIs and metrics they use to measure performance against goals. Also, find out if there are any additional KPIs that they want to start tracking henceforth.
Also, find out how they want this information to be delivered (via PDF, email, etc) and how frequently.
3. Design Dashboard Mockup
Once you have a clear idea about HR metrics & KPIs to track, you need to use a dashboard software to mock up your dashboard design. It is advisable to organize your KPI metrics into 3 layers – arrange the most important and urgent metrics at the top, trends, distributions and comparisons in the middle, and granular details at the bottom.
While designing your HR dashboard, it is also important to choose the right visualization for each KPI metric, so that your dashboard reports are intuitive and easy to understand.
Bonus Read : Top 5 Dashboard Features for Business Dashboard
HR KPI and Metrics
Here are the key HR metrics and KPIs you must track on your HR dashboards and reports.
1. Absence Rate
Absence rate is one of the most important HR KPI metrics. It is basically the percent of workers absent during a given time period
Absence Rate = (Absence Days / FTE) * 100
2. Monthly Turnover Rate
Employee attrition or turnover is a major problem for every business. Monthly turnover rate measures the number of employee separations every month, including retirements, firings, resignations.
It is important to regularly monitor turnover rate, else it can lead to staff shortage at crucial times.
3. Engagement Rate
Engagement rate is a key HR metric to measure employee satisfaction and indicates how engaged and motivated they are towards their work. Good engagement rate leads to low turnover rate and better morale.
Engagement is measured using employee surveys or other kinds of HR reporting.
4. Cost Per Hire
Hiring is one of the key responsibilities of HR department. So it is important to track the cost per hire. On an average, the cost to hire an employee is equal to that employee’s salary for 1 month. It includes the costs for ad placement, background checks, availing employment services, and even training them.
Tracking cost per hire helps HR managers estimate annual budget for recruitment and training.
5. Overtime Hours
Too much overtime can burn out employees, lead to more overtime pay, and reduce employee morale. If many employees are putting in overtime consistently, then it is important to hire more employees and streamline processes.
Bonus Read : Top 5 CRM KPIs & Metrics
HR Dashboard Examples
Here’s an example of HR Dashboard created using Ubiq.

Ubiq makes it easy to visualize data in minutes, and monitor in real-time dashboards. Try it Today!
Sreeram Sreenivasan is the Founder of Ubiq. He has helped many Fortune 500 companies in the areas of BI & software development.