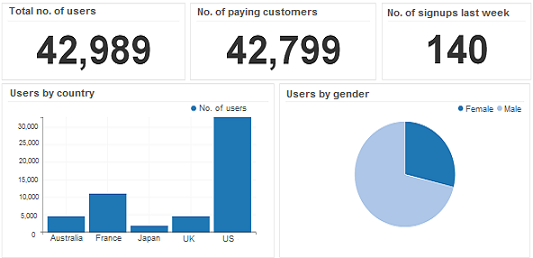
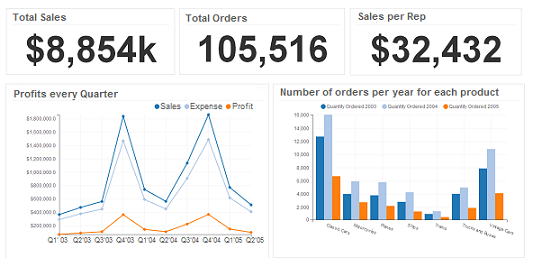
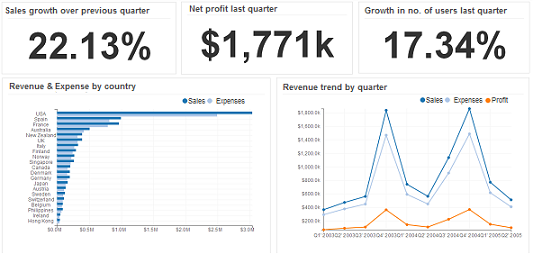
MySQL Database Visualization Tool like Ubiq enables you to create data visualizations from MySQL, in minutes. Visualize data using web interface. Vizualize data in real-time. Export visualizations and dashboards as PDF, PNG, etc. Share visualizations & collaborate with others.
See how easy it is
Create data visualizations using drag & drop. See results in beautiful charts & dashboards. No programming required.
Real-time Data visualizations show live data and update automatically.
Visualize data from multiple sources using web browser. Pull data from multiple databases in a single dashboard report. Create visualizations from MySQL, PostgreSQL, Amazon Redshift, RDS. More data sources to be added soon.
Visualize MySQL data in your Website or App, or applications like Magento, Drupal, Wordpress, etc. or business areas like Sales, Marketing, Operations, HR, IT, etc.
Visualize data anywhere, anytime - on laptop, tablet or mobile. Works with MySQL on Linux, Windows & Mac.
Easy to use data visualization tool that can be setup in minutes. Avoid waiting for demo or installation. Sign up & immediately start immediately.
Securely visualize MySQL data and share visualizations with others. Ubiq connects to your databases with read only access. Assign create or view permissions to your team mates.
Trusted by customers around the world
What our customers say
“Ubiq has given us instant access to all our data. The charts are very smart and work very well for us on our wall mounted monitors. Would I recommend it to others? Definitely YES YES YES.”
Mary Blount
IT Manager, MinsterSoft
“Our IT company from Belgium (TIGRON) is very happy to use Ubiq, they have suggested to some of their clients too.”
Vassilios Lourdas
Systems Engineer, KNX Association
Business Intelligence, Dashboards or Analytics. Whatever you need, Ubiq can help
Try Ubiq for free