Data Analysis tool for your Business
-
✓ Identify patterns & relationships
-
✓ Gain meaningful insights
-
✓ Powerful data visualization
-
✓ Affordable Data Analysis Tool
Try ubiq for free!

Ubiq is an easy-to-use data analysis tool that makes it easy to analyze data, discover patterns & trends, and draw insights from data. It provides a wide range of analytical functions and features to help users investigate data deeply. Ubiq supports a variety of advanced visualizations that enable users to easily visualize data into easy-to-understand patterns. Users can create charts, graphs, tables and even maps to present their insights. They can even create interactive dashboards & reports to share insights with others.
See how easy it is

Ubiq data analysis tool enables users to perform data analysis using an intuitive drag and drop interface. This allows even non-technical users to quickly dig into data and draw insights. Users can choose from a variety of advanced visualizations to identify patterns and discover hidden trends in data. They can easily create charts & reports to present results of data analysis. Since ubiq is a web-based solution, users can quickly share these reports with others. This improves collaboration and improves discussion of analysis results. Ubiq provides many powerful functions out-of-the-box, that enable users to quickly design and run custom data analysis. It enables users to filter, slice & dice and drill-down data. With advanced analytical capabilities like pivot table, cross-tabs, and search functionalities, Ubiq analytics provides an immense ROI.
Ubiq data analytics tool enables users to analyze data in real-time. It allows users to run data analysis in real-time. Ubiq plugs into live-data and shows analysis trends & insights based on the latest data. This enables users to quickly understand data and draw insights as they happen, in real-time. Also, ubiq automatically refreshes the data analysis with the latest data. Users don't need to re-build or re-configure their analyses. This enables users to detect any change in analysis results as soon as possible. This saves a lot of time for the users and makes Ubiq a hassle-free analytics platform. Also, Ubiq enables users to visualize data in real-time. Users can easily drag a few columns and Ubiq will immediately create data visualizations for them. Being able to analyze data in real-time enables users to draw insights & share them with others, all in a matter of minutes.


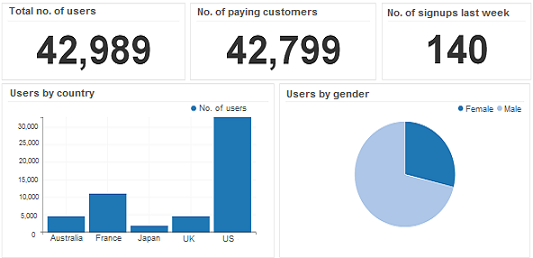
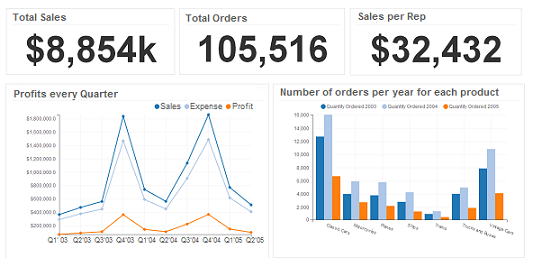
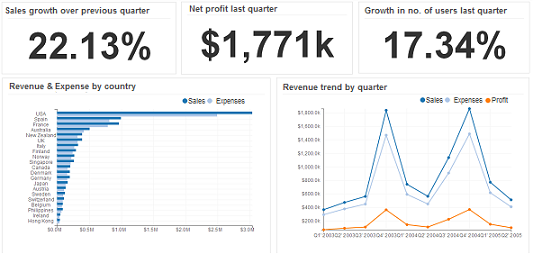
Ubiq allows users to visualize data in many different ways. It provides many advanced visualizations that enable users to easily explore data and quickly recognize hidden patterns. This makes it easy to explore the results of data analysis from various points of view. This enables users to clearly communicate insights hidden in data. Users can use these visualizations to build charts & reports and present their findings to others. Ubiq's advanced visualizations enable users to identify trends in data, draw comparisons, recognize key components. They can also spot outliers and exceptions, and refine data analysis. Ubiq enables users to analyze data in nearly unlimited ways. It provides powerful analytical functions out-of-the-box which users can directly apply to analyze data.
Ubiq enables you to analyze data directly using web browser. It allows users to query data, run data analysis and report analytics results using web browser. This enables users to analyze all their data from one place, and share the results with others. It ensures everyone is looking at the same numbers and improves collaboration. There is no need to upload or move data around. Ubiq allows users to draw insights from data, no matter where it is located, directly using web browser. Ubiq allows users to pull data from multiple sources, explore, visualize & report them simply using web browser. Analyze and report every area of your business like Sales, Marketing, Operations, HR, IT, etc.


Ubiq allows you to easily share results of data analysis. You can quickly add team mates to your analysis and give them access to reports. Users can share reports and charts by simply sharing a URL. Avoid emailing static excel reports back and forth. Since these reports are web-based, they are dynamic and interactive. Users can filter, slice & dice or drill-down data on-the-fly. This helps them investigate further into key trends and patterns. Also, users can export analysis results in a variety of formats. Ubiq also allows you to schedule email reports automatically. This enables you to stay up-to-date, all the time.
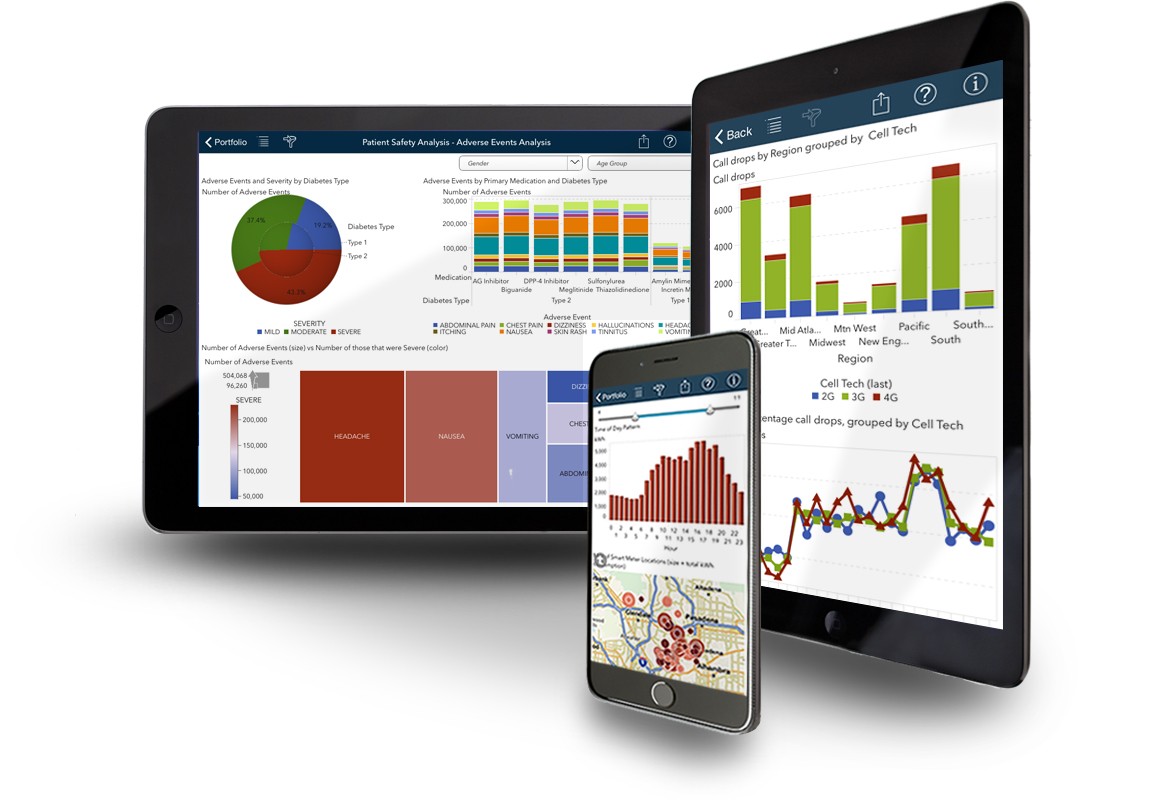
Run data analysis on-the-go. Ubiq makes it easy to run data analytics using any device - mobile, tablet or PC. This makes it very easy for teams to analyze data. Analysts can perform data analysis on workstation or laptops and draw detailed insights from data. They can share these insights with Managers and Executives who can access them on a mobile or tablet. Also, each user may have different requirements. Ubiq allows you create detailed reports or summarized results of analysis. This enables users to draw insights anytime, any where. They can easily go through the reports, at home or in office, spot key trends and immediately share them with others.
Data Analysis Tools make it easy to explore, visualize and analyze data. They enable you to design custom data analysis and draw insights. Ubiq provides a wide range of analytical functions that allow users to perform advanced data analysis such as aggregation, filtering, slice & dice, and even drill downs. This allows users to perform complicated calculations and extract the information they require for analysis. Users can present the results of data analysis using many advanced visualizations. This helps users easily visualize data and explore hidden patterns and trends. It enables them to spot outliers and exceptions. They can use advanced analytical capabilities to investigate these anomalies further. Web-based Data Analytics Tools enable users to not only design & run data analysis using web browser but also share results of data analysis with others. It creates a single source of truth. This makes it easy for users to collaborate and discuss insights, improve faster.
Some of our valuable customers across various countries