Data Visualization Tools that just work
-
✓ Create interactive data visualizations
-
✓ Get blazingly fast insights
-
✓ Visually analyze data
-
✓ Share visualizations with others
Try ubiq for free!
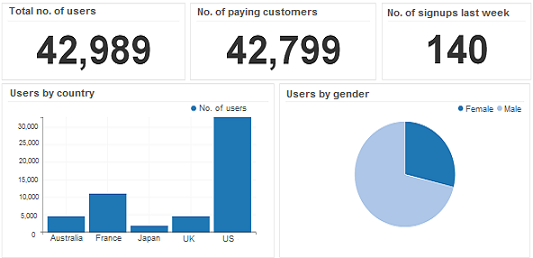

Data Visualization Tools help you easily see and understand data. Create interactive data visualizations in minutes. Explore, analyze data & share insights with beautiful & interactive dashboards. Visualize your data in real-time and get meaningful insights. Customize visualizations & dashboards with a few clicks. Share/export visualizations in a variety of formats. Schedule automatic email reports.
See how easy it is

Data Visualization Tool that anyone can use. Easily create stunning charts, tables & graphs with our intuitive interface. Turn data into visualizations using simple drag & drop. Customize labels, tooltips, designs using point and click. Our intuitive tool can help you create interactive visualizations and share business insights in your organization. There's no programming language or APIs to learn. Flexible & powerful way to explore, visualize & share data. Empower everyone in your organization to find data-driven answers, on their own.
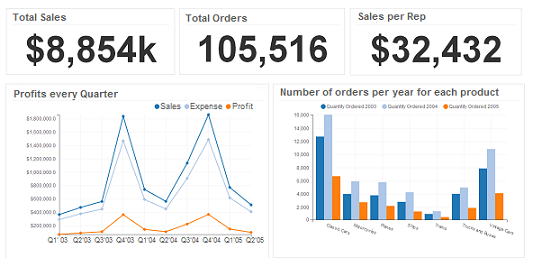
Today, every business generates so much data that it can be difficult to organize and present it intuitively. As a result, you may miss the latest insights. Everyday you get a lot of new data about your business. It can be tedious and time-consuming to re-build visualizations, every time your data is updated. Instead, connect directly to your data and get live, up-to-date insights in beautiful & interactive real time dashboards. Share insights via dashboards so everyone can see the same data, ask more questions and get better answers. Visualizations & charts automatically update with latest information. Ubiq Data viz tool helps you see patterns, identify trends & discover visual insights in seconds. Simplify visual analytics for your organization. Interpret data graphically.

In today's organizations, data is present at multiple locations in different formats. It can be tedious to aggregate and analyze all this data to understand it. Ubiq enables you to access & visualize all your data in one place, using dashboards. Dashboards are powerful as they allow you to relate information visually. You can visually analyze data and graphically interpret information. Use visualizations to quickly draw attention to the key insights. Present data visually to uncover surprising patterns and observations that wouldn't be evident from looking at stats alone. Ubiq is a data visualization tool for your data, no matter where is located.
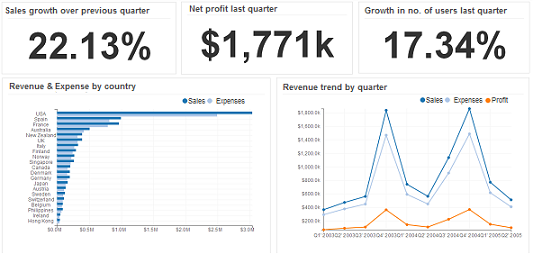
Easily build real-time visualizations of aggregate metrics for internal dashboards. Build visualizations for all types of online businesses like Ecommerce, SaaS, Mobile Apps, Reporting agencies, IT firms, etc. Create highly interactive, dynamic & engaging visualizations for all areas of your business like Sales, Marketing, Operations, etc. You can even use it with your website data or third party tools like Magento, Wordpress, etc.
It's painful to mail static visualizations to each other. Also, you need to constantly update visualizations with the latest data. Instead, create visualizations and dashboards using web browser. Being web-based, these visualizations are interactive and dynamic in nature. You can access them on mobile, tablets or PC. This ensures that everyone is looking at the same data. People can easily share insights, ask questions and find answers. It works efficiently and allows users to explore and interpret dense data sets. Ubiq provides online data visualization tools so you can access information anywhere, anytime, collaborate and share insights with others.
Ubiq is not just powerful but an easy-to-use tool with many visualization options. It has simple, point-and-click interfaces, and doesn't require that you possess any particular coding knowledge or invest in any training. Let the software do the hard work for you. Creating charts, visualizations & dashboards can be time consuming. Ubiq makes it easy for you, your organization & clients. A web application for visualizing data flexibly and easily. Way better than open source solutions.

People can understand visuals better than a table of rows & columns. With so much data proliferating every area of business, it's becoming difficult to analyze & understand it. That's where data visualization tools come into picture. Data Visualization tool enables users to visualize data, draw insights and understand it better. It allows people to organize and present information intuitively. By visualizing data, you are able to ask more questions and quickly find answers. People can share insights and understand data better. You can combine visualizations into a dashboard. Dashboards are useful because they allows you to relate different views of information visually. You may create operational dashboards that are used over and over again, or create dashboards on the fly to dig deeper into an issue. Data Visualization tools provide valuable decision support by allowing users to quickly create and modify dashboards. Being web-based, they enable people to share visualizations and insights, and collaboratively make decisions.
Some of our valuable customers across various countries