
Marketing dashboard helps you measure marketing performance, evaluate strategy and make better decisions. It is also a great tool to prove marketing ROI and get more budget. Here’s how to create marketing dashboard for your business and clients.
How to Create Marketing Dashboard
Here are the steps to create marketing dashboard.
1. Determine Your Target Audience
The most important step when you create marketing dashboard is to clearly identify your dashboard’s target audience. Who will use your dashboard? How will it help them?
Different audiences have different requirements. Executives need high-level summary metrics & KPIs about marketing strategy.
Social media marketers need a consolidated dashboard of all social media metrics & KPIs from Twitter, Facebook, LinkedIn, Instagram, and other platforms.
The performance metrics & KPIs in your marketing dashboard will differ based on the organizational role of your target audience.
Bonus Read : How to Create Content Marketing Dashboard
2. Understand the Business Objectives & Goals of your Audience
Understand the key business goals & objectives (short-term and long-term) of your marketing dashboard’s target audience, and build marketing dashboards that will help them measure performance against their goals.
In the above example, executives will be interested in evaluation of strategic performance, so they will look for return on investment and budget.
Social media marketers will be interested in increasing brand awareness, and need to track likes, comments, shares, etc on social media platforms.
Ensure that your marketing dashboard makes it easy for end users to measure performance against goals, get insights between related marketing elements, and identify areas of improvement.
Bonus Read : Key Dashboard Principles for Successful Dashboard
3. Determine Marketing KPIs & Metrics
Depending on the target audience and their business goals, it is important to clearly identify KPI metrics that will be relevant to your users, and help them do a better job.
If your end user is a marketing manager, they might be interested in campaign performance metrics such as likes, clicks, time on site, traffic, CTR, etc.
On the other hand, executives will look for high-level performance metrics like conversion rate, ROI, etc.
When you create marketing dashboard, don’t use the same performance metrics for everyone. Personalize them according to your target audience.
Bonus Read : Top 5 Retail KPIs & Metrics to Monitor
4. Determine data sources
While deciding the performance metrics to be displayed on your marketing dashboard, it is important to figure out the formula, calculation steps and data sources for each KPI.
Plot each metric’s present value as well as past performance (previous month, quarter, year). This will help users understand how each metric is performing.
Also plot each metric’s performance against goal, to help users understand where they stand with respect to their business objectives. It is a very useful way to show your audience how their investments and efforts are working.
Each marketing channel (email, social, seo, content) offers tons of data for reporting & analysis. If possible, gather and integrate these multiple data sources under one roof, in a single database or warehouse.
This will help you easily calculate complicated performance metrics like ROI that require data from multiple sources.
5. Create Marketing Dashboard
Organize your marketing KPI metrics into 3 layers when you create marketing dashboard for your business and clients.
Display the most important metrics at the top, trends & comparisons in the middle, and granular data at the bottom.
Group related metrics together so that it is easy for users to draw connections and comparisons. For example, place social media metrics near each other.
Bonus Read : How to Design a Dashboard For Your Business
Show only up to 15 metrics on marketing dashboard, otherwise it will look cluttered. Similarly, pick 3-4 colors and use them uniformly across all visualizations. This will make your dashboard look consistent.
Use descriptive titles for each metric so that users can easily understand the information displayed in it. Also add footnotes to mention any caveats or assumptions.
Finally, send an email or slideshow to your audience that briefly describes what your dashboard is meant to convey, and what each metric stands for. This will help them quickly understand your dashboard.
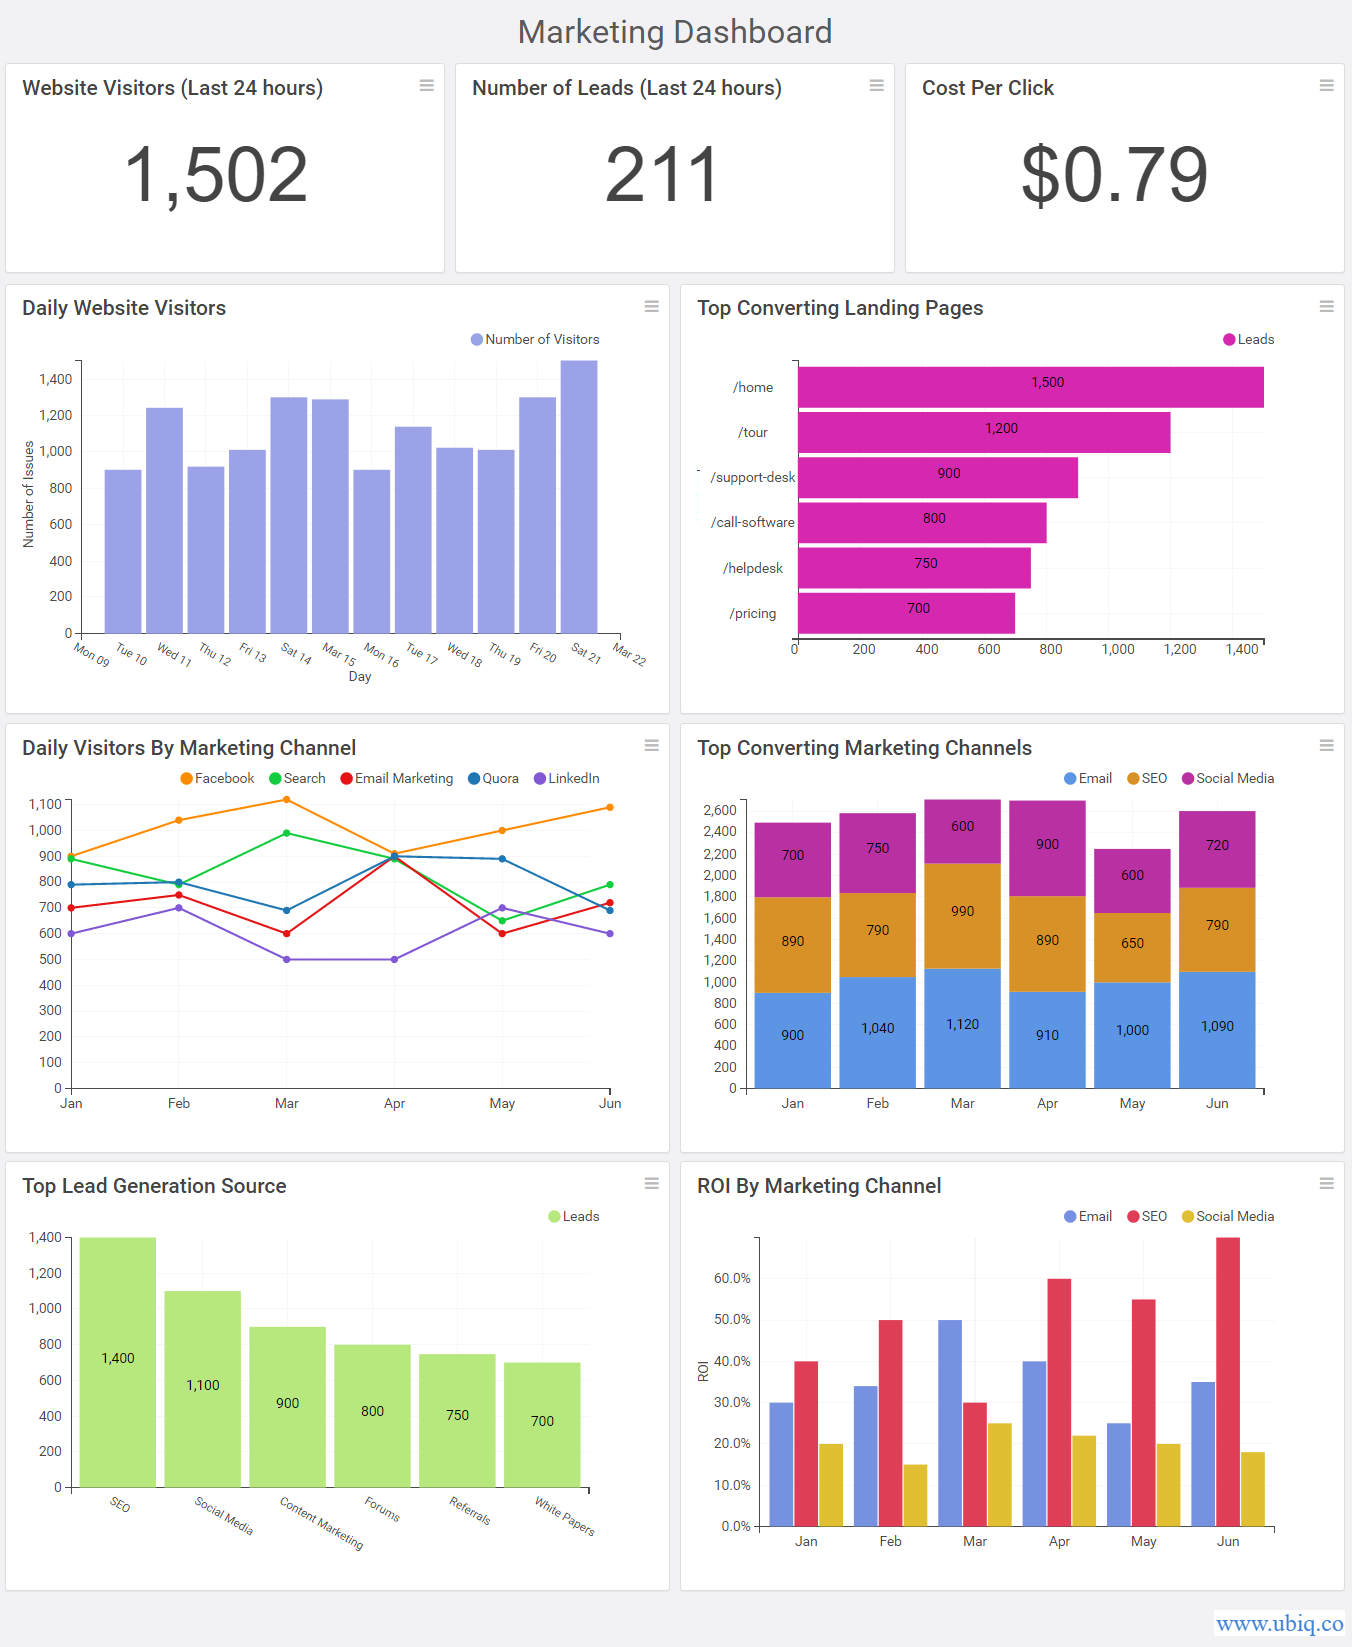
Here’s an example of a marketing dashboard created using Ubiq.
Hopefully, the above tips & best practices will help you create marketing dashboard for your business and clients.
Ubiq makes it easy to visualize data in minutes, and monitor in real-time dashboards. Try it Today!
Sreeram Sreenivasan is the Founder of Ubiq. He has helped many Fortune 500 companies in the areas of BI & software development.