Ubiq MySQL Reporting
MySQL Reporting Software for Reports & Dashboards
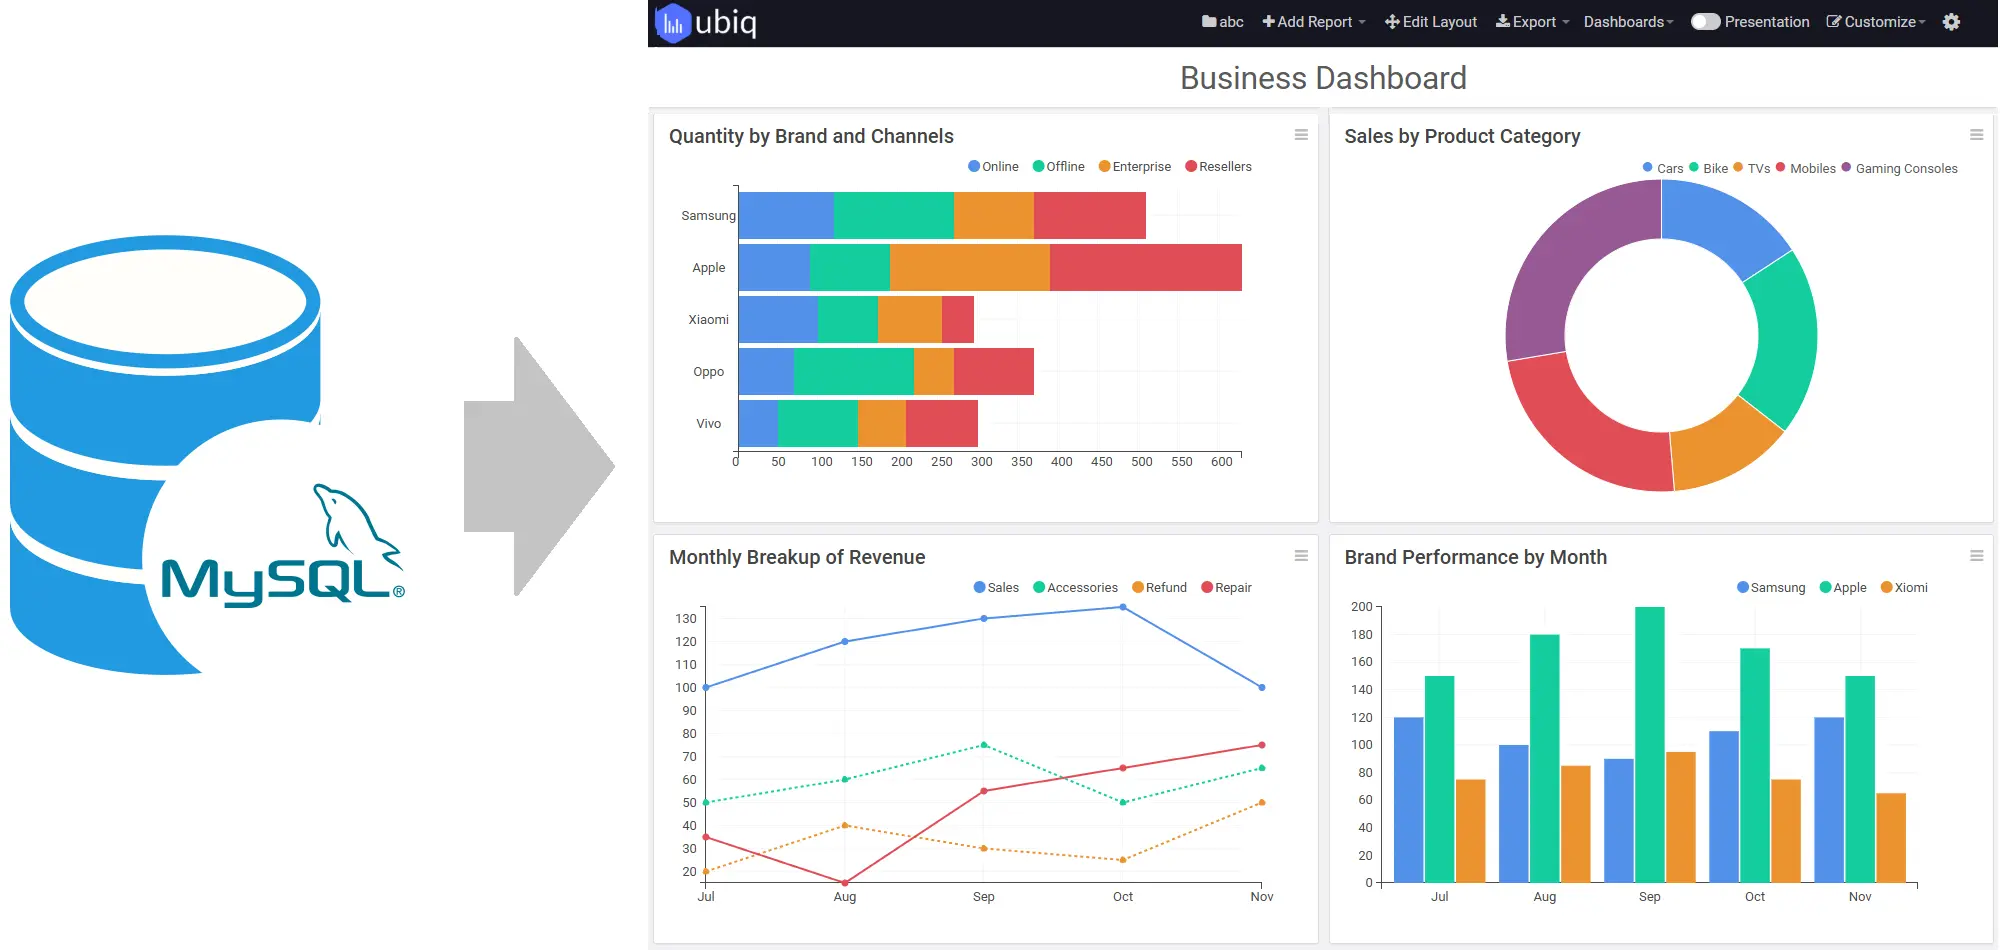
Turn your MySQL data into interactive reports and dashboards with Ubiq. Create reports using drag and drop or SQL, visualize current business data, apply powerful filters, and securely share insights with your team.
- Create MySQL reports and dashboards in minutes
- Build reports using drag & drop or SQL
- Analyze local, remote and cloud MySQL data
- Create interactive, real-time reports
- Export and securely share reports with your team
Trusted by Businesses Worldwide
Teams use Ubiq to turn database data into reports and dashboards.


Visual MySQL Report Builder
Create MySQL Reports Using Drag & Drop
Build useful reports without making every business user write SQL.
Ubiq provides a visual MySQL report builder that lets you select fields, group and summarize data, add filters, and create charts using an intuitive drag-and-drop interface.
Create summary reports for everyday monitoring or detailed reports for deeper analysis. Apply sorting, grouping, calculations and formatting to turn database rows into information your team can understand.
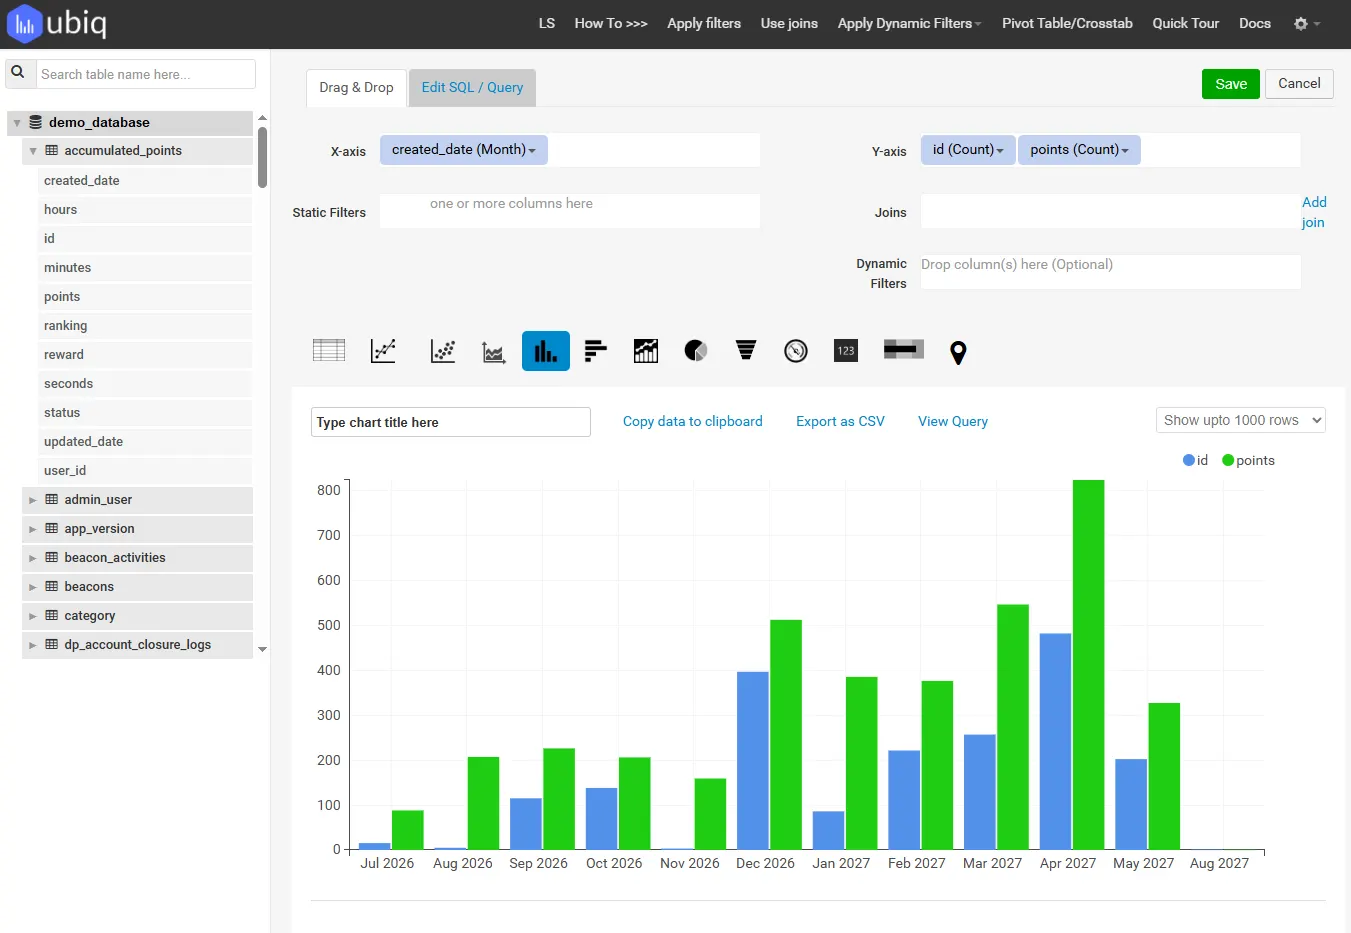
SQL Reporting
Create MySQL Reports Using SQL
Prefer writing queries? Use SQL when you need precise control over your data.
Technical users can create and modify SQL queries for MySQL and turn the results into charts, tables and dashboards. This gives analysts and developers the flexibility to work directly with SQL while business users can continue using the visual report builder.
Use SQL for custom calculations, joins and reporting logic, then present the results through Ubiq's visualization and sharing features.
Choose the workflow that fits the report
Create reports with drag and drop, filters, grouping and chart configuration.
Write or modify SQL queries when advanced reporting logic is required, using our SQL reporting tools.
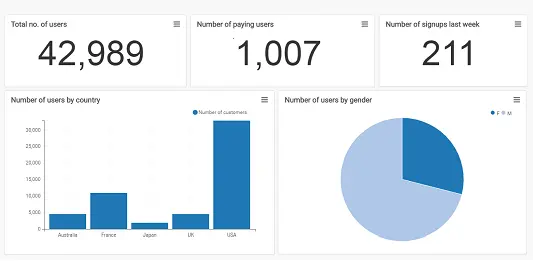
Multi-Database Reporting
Query Data from Multiple Databases
Analyze related information across more than one database without repeatedly exporting and merging data by hand.
Connect multiple supported databases and bring related data together in unified reports and dashboards.
This is useful when customer, sales, operational or application data is distributed across different MySQL databases or other supported relational databases. Build reports that give users a more complete view of the information they need to make decisions.
- Work with data from multiple supported databases
- Analyze related information in a common reporting workflow
- Reduce manual spreadsheet exports and data merging
- Create unified reports for cross-database analysis
Advanced SQL Reporting
Build Complex Reports with Nested Queries & Formulae
Handle advanced reporting requirements without limiting yourself to simple SELECT statements.
Ubiq gives technical users the flexibility to create sophisticated MySQL reports using custom SQL logic. Use nested queries, joins, aggregations and calculated expressions when your reporting requirements go beyond basic filtering and grouping.
You can also use formulae and calculated fields to derive business metrics from your source data, then present the results as charts, tables and dashboards that are easier for business users to understand and explore.
Support advanced reporting logic
- Nested queries and subqueries
- Joins across related tables
- Aggregations and grouping
- Calculated fields
- Formulae and derived metrics
- Conditional reporting logic
- Parameterized queries
- Reusable SQL-based reports
Live Data
Build Real-Time MySQL Reports & Dashboards
See current information without repeatedly exporting your MySQL data to spreadsheets.
Ubiq creates reports from connected MySQL data and supports automatic refresh so your reports and MySQL dashboards can reflect the latest available information.
Use interactive filters and drill-down to move from a high-level view of performance to the details behind a number. This makes Ubiq reporting software useful for operational reporting, management reporting and other situations where current information matters.
MySQL Reporting Tools
Analyze and Visualize Your MySQL Data
A useful MySQL reporting tool should help you explore the data, not just display it.
Ubiq provides reporting and MySQL data visualization capabilities for turning MySQL data into charts, tables and interactive reports. Build an overview for monitoring performance, then filter or drill down when you need more detail.
Reporting and analysis capabilities
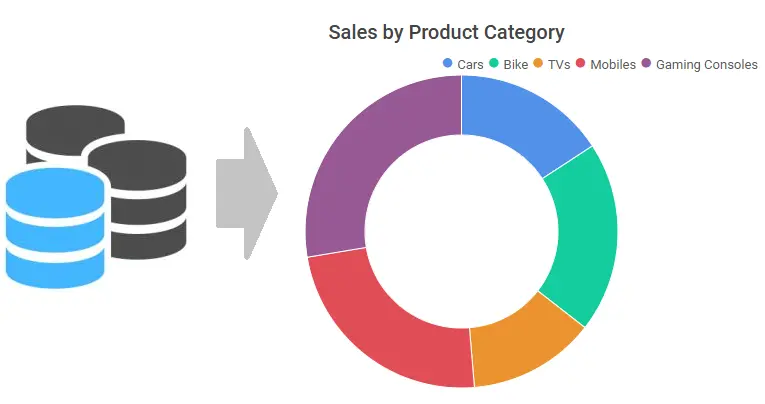
- Bar, column and line charts
- Pie and area charts
- Stacked and multi-series charts
- Tables and cross-tabs
- Filters and sorting
- Grouping and aggregation
- Calculated functions
- Dynamic filters
- Parameterized queries
- User inputs
- Drill-down analysis
- Automatic data refresh
Database Connectivity
Report on MySQL Data Wherever It Lives
Create reports from supported local, remote, cloud or private-network databases.
Local MySQL
Create reports from MySQL databases used for local applications and development environments.
Remote MySQL
Connect to supported remote databases and build browser-based reports for your team.
Cloud & Amazon RDS
Create reports for MySQL data hosted in supported cloud environments, including Amazon RDS.
Private Networks
Support reporting workflows for databases that run inside an intranet or private network.
Ubiq also supports reporting workflows involving compatible sources such as MariaDB and other supported relational databases when you need to analyze information beyond a single MySQL database.
Business Reporting
Create MySQL Reports for Any Business Use Case
Build reports around the questions your teams need to answer.
Sales Reports
Track revenue, customers, products, orders, conversions and other sales metrics stored in MySQL.
Marketing Reports
Analyze acquisition, campaign and customer data from websites and applications backed by MySQL.
Operations Reports
Monitor transactions, activity, service levels and other day-to-day operational information.
Management Reports
Give managers a clear overview of KPIs with the ability to drill into the supporting details.
Application Reports
Report on data from websites, SaaS products, CMS platforms and other applications that use MySQL.
Security
Secure MySQL Reporting
Give people access to reports without casually exposing your database.
Ubiq supports secure reporting workflows for MySQL, including SSH connectivity for supported cloud environments and read-only database access for reporting.
For private-network or intranet deployments, Ubiq can use an agent-based approach so reporting can work with data inside your network. You can also control whether team members can create or only view reports.
Read-only access
Use database credentials intended for reporting rather than giving users unnecessary write access.
SSH connectivity
Support secure connectivity to MySQL in compatible hosted environments such as AWS.
Private-network reporting
Use Ubiq's agent-based architecture for supported intranet and private-network reporting scenarios.
Team permissions
Control who can create reports and who should have view-only access.
Sharing & Export
Share MySQL Reports With Your Team
Turn a database query into information other people can actually use.
Build reports once and make them available through a web browser instead of sending multiple spreadsheet copies around the organization. Give colleagues access to the same report and current business information.
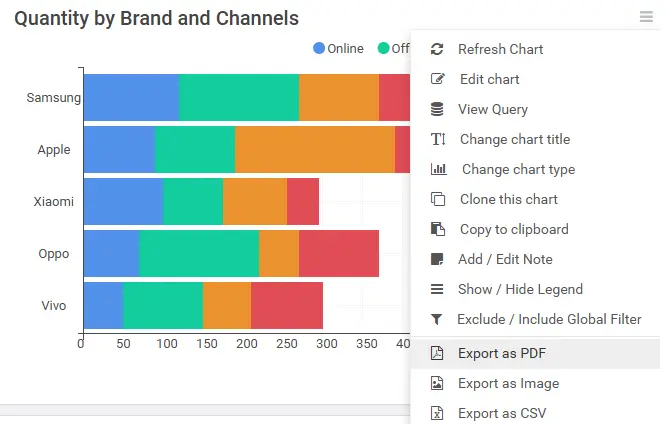
When you need an offline copy, export supported reports in formats such as PDF, PNG or CSV.
Customer Stories
Trusted by Teams That Rely on Their Data
See how businesses use Ubiq to make reporting and analytics faster and easier.
“Several departments use Ubiq... Looks like all departments use Ubiq. It’s our main analytics tool.”
 Ilya Arhipov
Operations Director, Esprit Games
Ilya Arhipov
Operations Director, Esprit Games
“Ubiq has given us instant access to all our data. The charts are very smart and work very well for us.”
 Mary Blount
IT Manager, MinsterSoft
Mary Blount
IT Manager, MinsterSoft
“Ubiq is a very very good and useful product. It easily saves 10x the time needed to write a query and filters.”
 Mo Ghaoui
CEO, GAMING DOT ME LLC
Mo Ghaoui
CEO, GAMING DOT ME LLC
“We have been using Ubiq for our team of 15 members for more than 2 years.”
 Fernando Gomez
IT Manager, QBE International
Fernando Gomez
IT Manager, QBE International
MySQL Reporting Workflow
From MySQL Data to Business Report in Minutes
Ubiq simplifies the reporting workflow from database connection to shared insight.
Connect MySQL
Connect Ubiq to a supported local, remote, cloud or private-network MySQL database.
Choose your data
Select the tables, fields and metrics relevant to the business question you want to answer.
Build the report
Use drag and drop or SQL depending on the complexity of your reporting requirement.
Visualize results
Present MySQL data using charts, tables and other useful report formats.
Analyze
Use filters, calculations, sorting and drill-down to investigate the information.
Share
Give your team browser access to the report or export it when an offline copy is required.
Why Ubiq
Why Use Ubiq for MySQL Reporting?
Easy for business users
Create useful reports visually without requiring every user to know SQL or programming.
Flexible for technical users
Use SQL when you need greater control over queries and reporting logic.
Web based
Build, view and share MySQL reports through a browser instead of relying on desktop reporting tools.
Interactive analysis
Use filters, visualizations and drill-down to move from summary information to supporting detail.
Works with current data
Report on connected MySQL data and use automatic refresh for dashboards that need current information.
Built for sharing
Give teams access to common reports and export information when you need an offline copy.
FAQ
MySQL Reporting Frequently Asked Questions
Start Reporting
Turn Your MySQL Data Into Useful Reports
Stop manually assembling reports from database exports and spreadsheets.
Use Ubiq to create interactive MySQL reports and dashboards, analyze current data and share insights with your team.