Server Performance Metrics help you with server performance monitoring as well as application performance tracking. Here are the key server performance metrics you must monitor regularly. You can also use them to track application server performance metrics, Linux server performance metrics and system performance metrics.
Key Server Performance Metrics & KPIs to Track Regularly
Here are the key server performance metrics & KPIs you must monitor regularly.
1. Requests Per Second
Requests Per Second is one of the most important server performance metrics. It is equal to the number of incoming requests received by your website every second. It helps you measure server performance, server load, as well as concurrency.
Each requested page sends multiple requests(e.g html, css, images, js, dynamic requests, etc) to a server. They need to be counted separately while counting requests per second.
As the requests per second increases, your server’s throughput will decrease and it will slow down, unless you optimize your website/application or upgrade your server.
You can monitor the requests per second as a single number on a web server performance metrics dashboard and share with your team.

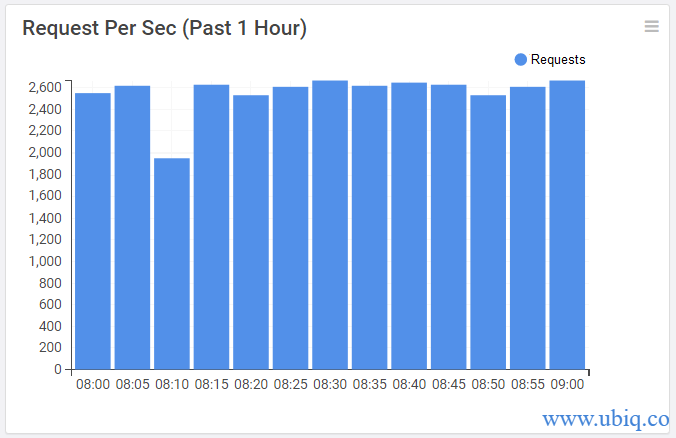
You can also monitor the total number of requests over time, in a column chart
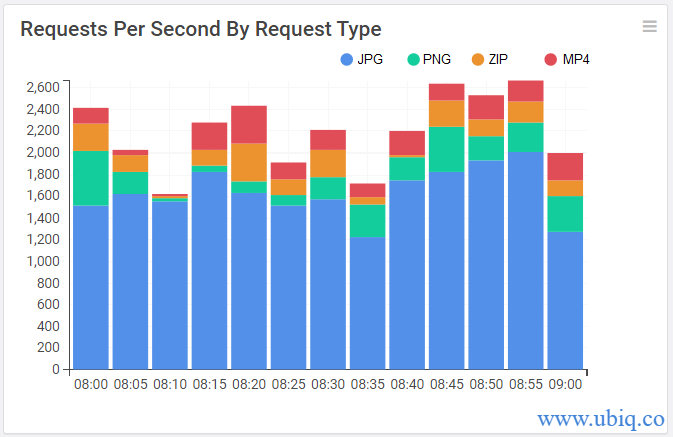
Further you can monitor requests per second for different types of files such as CSS, JS, JPG, HTML, etc. to identify bottlenecks quickly.
Bonus Read : What are the components of a successful dashboard
2. Data In & Data Out
Data In is the amount of data your website/application receives as input, and data out stands for the amount of data it sends out as responses. If you have a high data in rate, it means your application requires a lot of input before it can respond, and you may want to prune those inputs.
Similarly, if it has high data out then it means that it is sending a lot of data (through images, data dumps, etc) while responding to user requests, and you may want to optimize via compression.
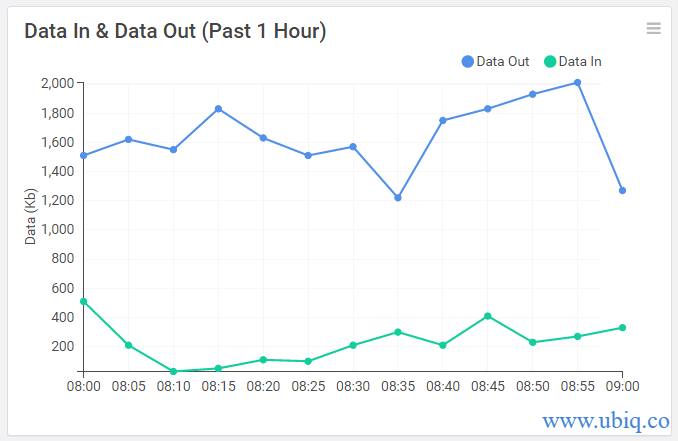
Again, you can monitor Data In & Data Out side by side in a line chart.
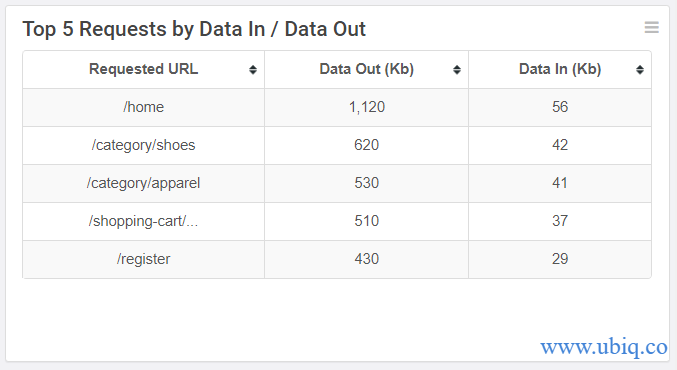
You can also track data in and data out by requested URLs to find out which ones are consuming most data.
Bonus Read : Key Database Performance Metrics to Track Regularly
3. Average Response Time
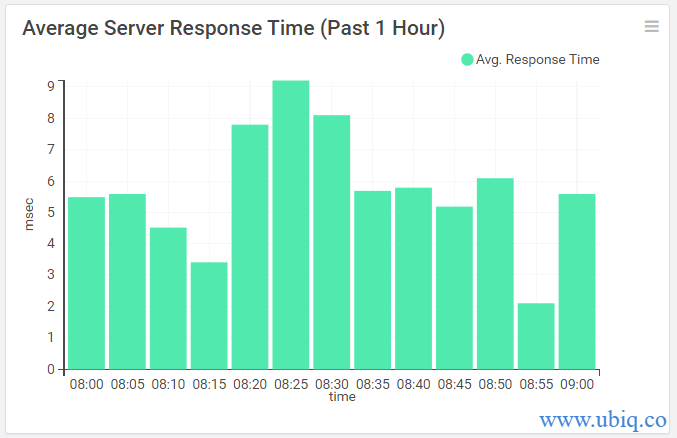
Average Response Time is one of the most popular server performance metrics to track. It is the average amount of time it takes for your server to process a request and send response. Higher Average Response Time indicates that your website/application is slow and might affect user experience.
So monitor your website/application’s average response time throughout the day to find out when your average response time increases.
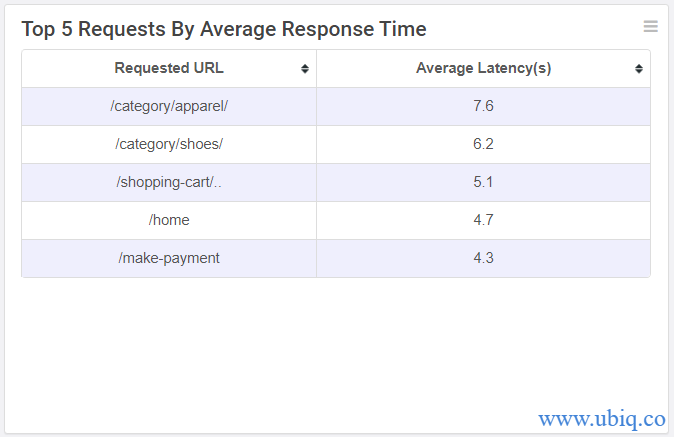
Similarly, track requested URLs with highest response times to find out which requests are slowing down your website.
Bonus Read : How to Choose the Best Dashboard Software
4. Number of Errors
It is important to monitor the type and number of errors returned by your server so that you can identify and fix them.
Whenever your server throws an error, it will return an error code. You can monitor the number of errors for most common 4-5 error codes such as 404, 405, 500, etc. using a line graph.
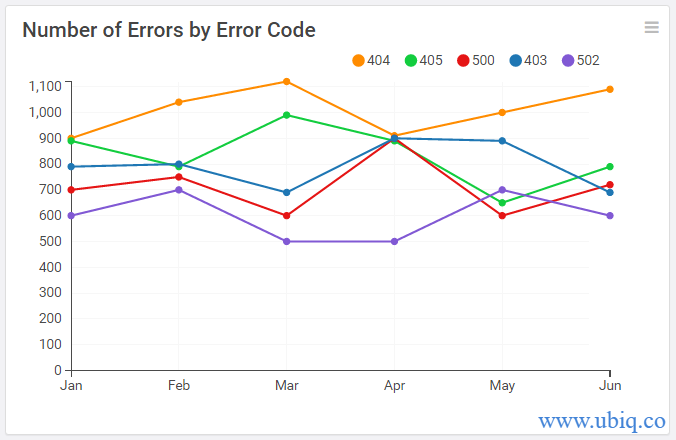
Based on number and type of errors you can take appropriate action. For example, 404 error code means broken links. You can use a broken link checker to identify and fix such links.
500 error code is an application issue and completely preventable.
5. Most frequent Requests
Also track 5-10 most frequent requests, along with their frequency and latency. Optimizing these requests will give your server significant performance boost.
Create a simple table report and share it with your team.
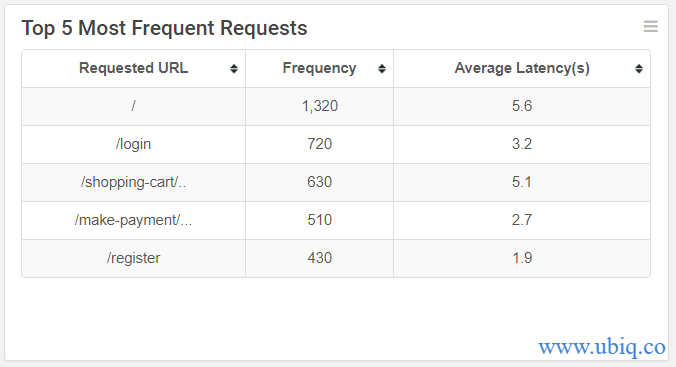
There are many server performance metrics out there but these are the ones that matter. Track these server KPIs and server-side metrics on a website server performance metrics dashboard using a data visualization tool like Ubiq, as shown below and share them with your team.
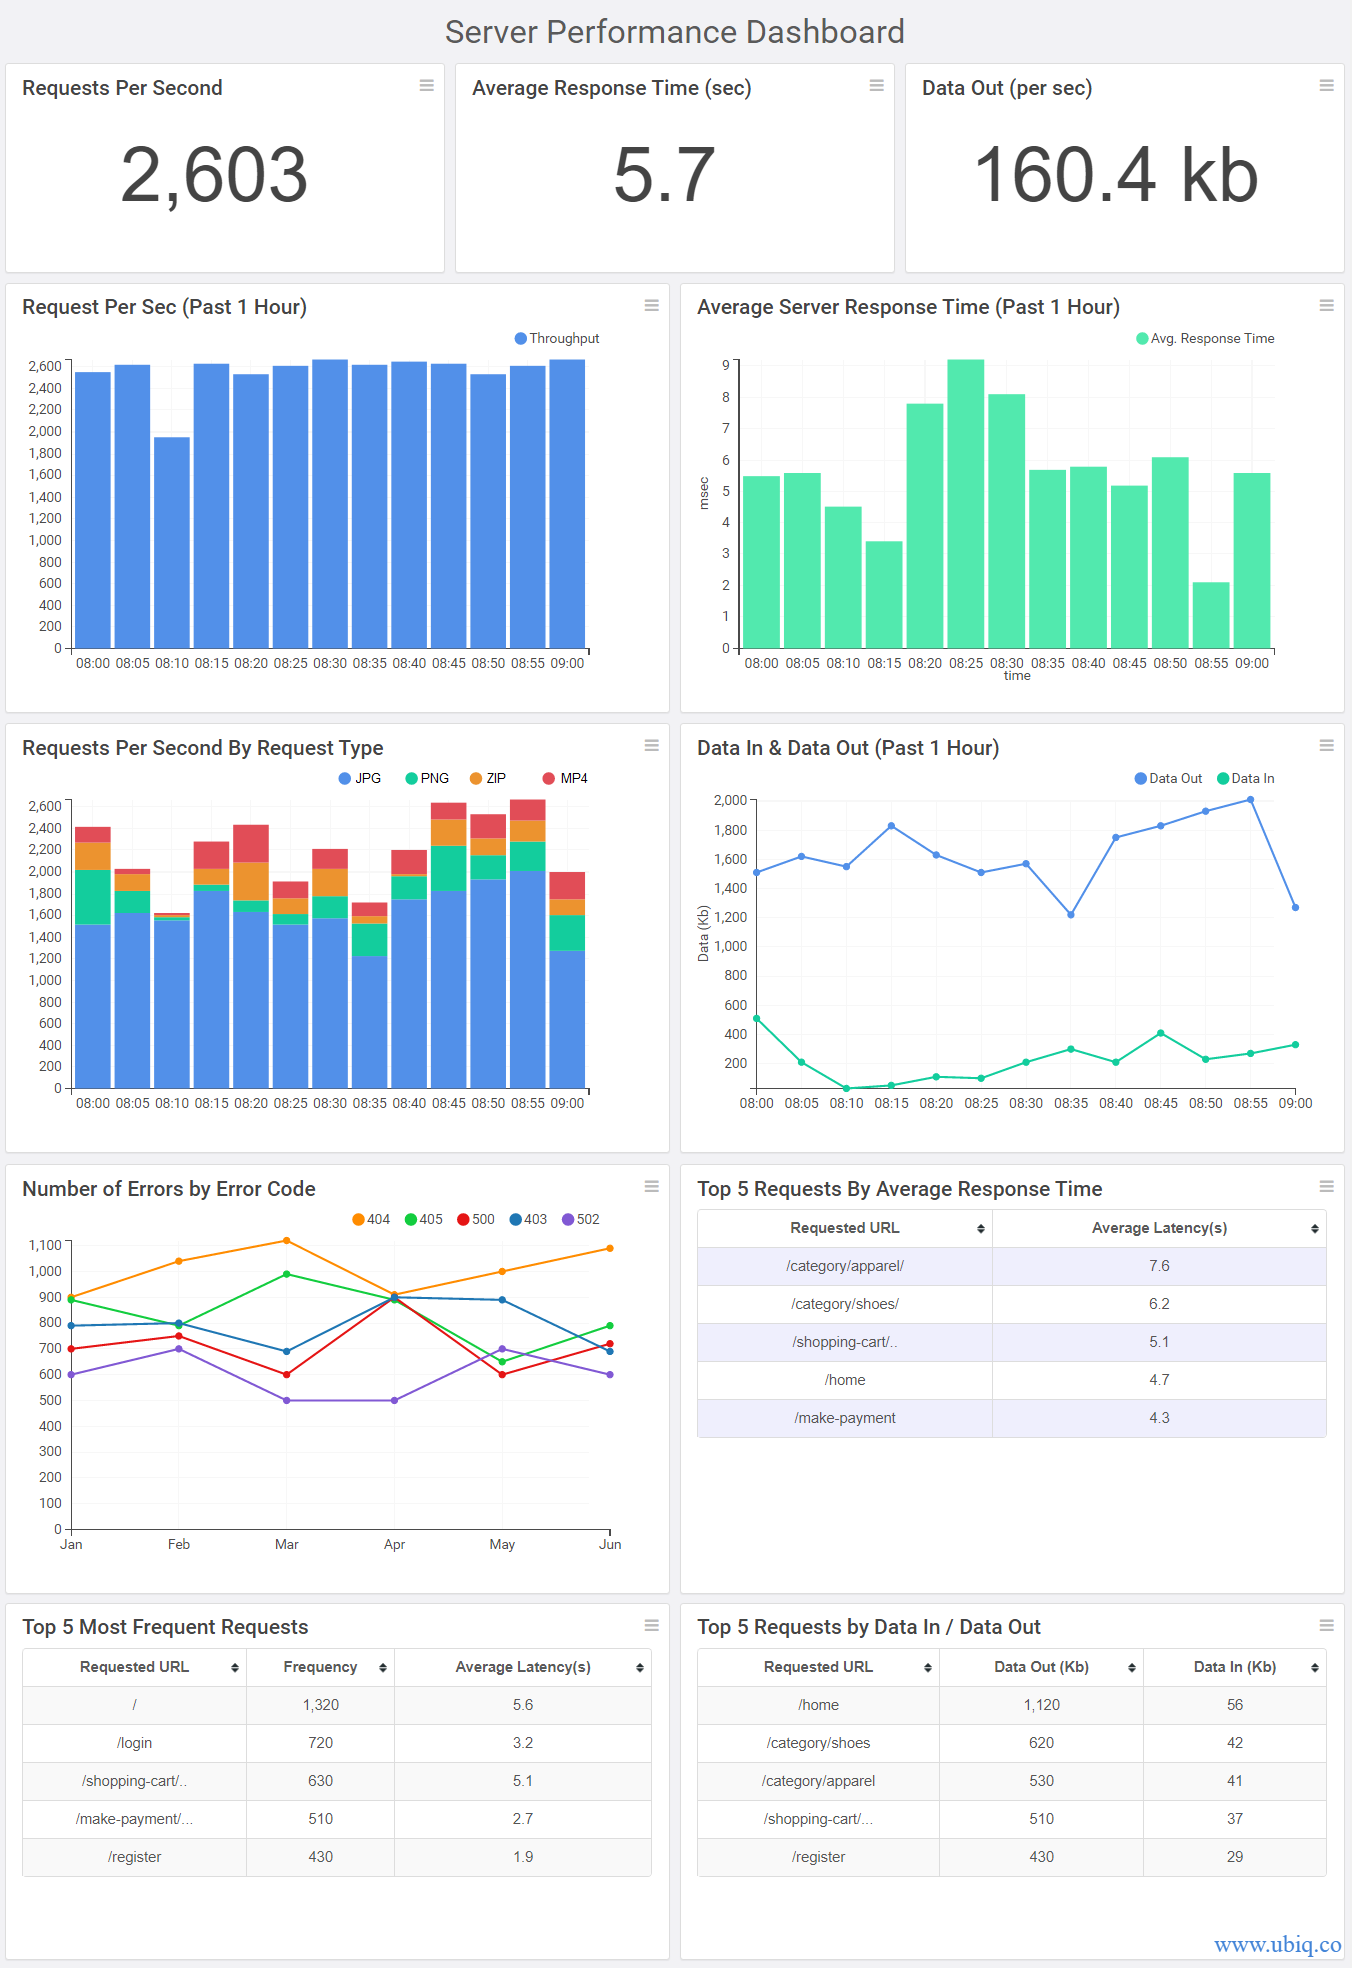
Hopefully, the above-mentioned key server performance metrics and KPI examples will help you improve your application/website performance.
If you want to create server performance monitoring dashboard, reports & charts, you can try Ubiq. We offer a 14-day free trial!
Sreeram Sreenivasan is the Founder of Ubiq. He has helped many Fortune 500 companies in the areas of BI & software development.