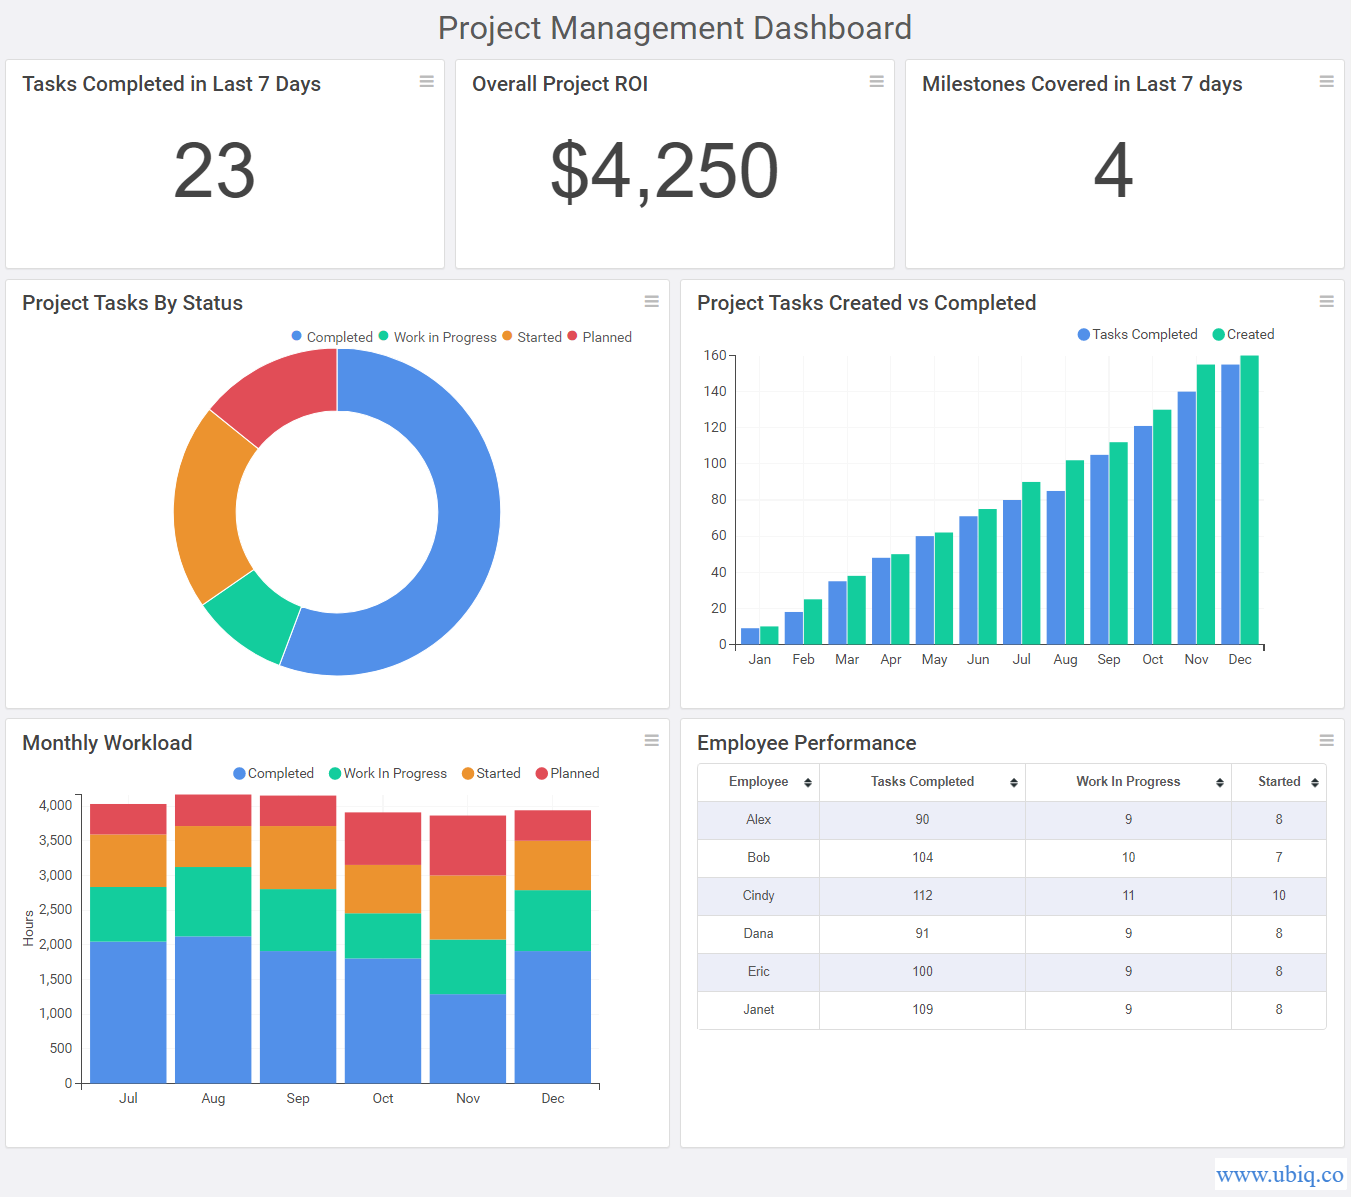
Project Management Dashboard allows you to get a quick overview of project performance status and review key project management performance metrics & KPIs to ensure that your project is on the right track. They also enable project managers and team leaders to identify issues early and fix them as soon as possible.
How to Create Project Management Dashboard – Examples & Templates
What is a Project Management Dashboard?
Project Management Dashboard is a visual collection of project management KPIs and metrics meant to give you a quick insight into project progress, and issues.
It is meant for project managers and team leads to help them with task management and team management. Project management dashboards allow them to monitor project performance on a regular basis.
Project management dashboards automatically gather, process and report project data from various systems in your organization. Therefore, they provide a single point of control for project managers and helps them make data-driven decisions.
Bonus Read : Financial Dashboards & Reports – Benefits, Examples, KPIs & Metrics
Benefits of Project Management Dashboard
Here are the key advantages & benefits of project management dashboards. They:
- Provide a single point of information for project management
- Give a visual presentation of project performance
- Help make data-driven decisions
- Send automatic alerts & emails to key stakeholders
- Give at-a-glance status of project performance
- Allow collaboration and communication
- Enable better task and team management
- Can be accessed anywhere, anytime, on any device
Bonus Read : HR Dashboards & Reports – Benefits, Examples, KPIs & Metrics
How to Create Project Management Dashboards & Reports
Here are the steps to create project management dashboards & reports.
1. Understand your target audience
The first step is to clearly understand who will use your project management dashboard and how. Mostly project management dashboards are used by project managers but in some organizations even product managers and team leads rely on them. Different people require different kinds of information from their dashboards, so it is essential to understand what your users want. For example, product managers will expect information on product development and management while team leads would need information about task and team management.
2. Identify Project Management KPIs and Metrics
Next, you need to determine the key objectives and goals of your target audience, and what KPI metrics they use to measure their performance against goals. Also, find out if they use any existing dashboards & reports to track project performance. Ask them if there are any additional KPIs they would like to start tracking.
Also determine how they would like to access their project management dashboards & reports (via pdf, web portal, email, etc)
3. Create Dashboard Mockup
Once you have figured out the target audience for your dashboard and what KPI metrics to display in it, use a dashboard software to quickly mock up your dashboard design. It is advisable to organize your KPI metrics in an intuitive and logical manner so that it is easy to understand your dashboard. Layout KPI metrics in 3 layers – the most important and urgent ones at the top, trends, distributions & comparisons in the middle, and granular data at the bottom.
Also, choose the right visualization for each metric, so that end users can easily draw insights and make decisions.
Bonus Read : Agile Business Intelligence & Data Analytics – Complete Guide
Project Management KPIs and Metrics
Here are the key project management KPIs and metrics you must track on your project management dashboards and reports.
1. Tasks Completed
Tasks completed is the number of tasks completed in your project. There are many ways to measure this KPI metric. You can track total tasks completed so far in your project, or the latest phase. You can also measure the number of tasks completed per week, or past 7 days. Nevertheless, it is essential to keep track of the number of tasks your team is able to complete.
2. Milestones Completed
Milestones are basically the key accomplishments in a project, or a project phase. It is important to monitor the number of milestones covered in your project. Project managers and team leads need this KPI metric to report project progress to their superiors.
3. Project ROI
Project ROI is one of the most important project management KPI metric that allows you to measure the financial value of the project.
Project ROI = net income on investment / cost of investment
OR
Project ROI = (net income on investment – cost of investment) *100/ cost of investment
4. Quality KPIs
It is not enough to only complete tasks and milestones. It is equally important to deliver high-quality work and keep your team happy. So you need to track quality-related KPIs such as client satisfaction, employee attrition, and net promoter score, and improve them over time.
5. Budget-based KPIs
It is important to keep an eye on project budget to ensure that costs & expenses don’t go out of control. Cost Performance Index (CPI) and Planned Value (PV) are two most important project management KPIs for budget. CPI measures the ratio of budget to actual expenses for each phase, while planned value is the estimated cost of project tasks & activities at the time of reporting.
Bonus Read : Best Marketing Dashboard Examples & Templates
Project Management Dashboard Examples
Here’s an example of project management dashboard created using Ubiq.

Ubiq makes it easy to visualize data in minutes, and monitor in real-time dashboards. Try it Today!
Sreeram Sreenivasan is the Founder of Ubiq. He has helped many Fortune 500 companies in the areas of BI & software development.