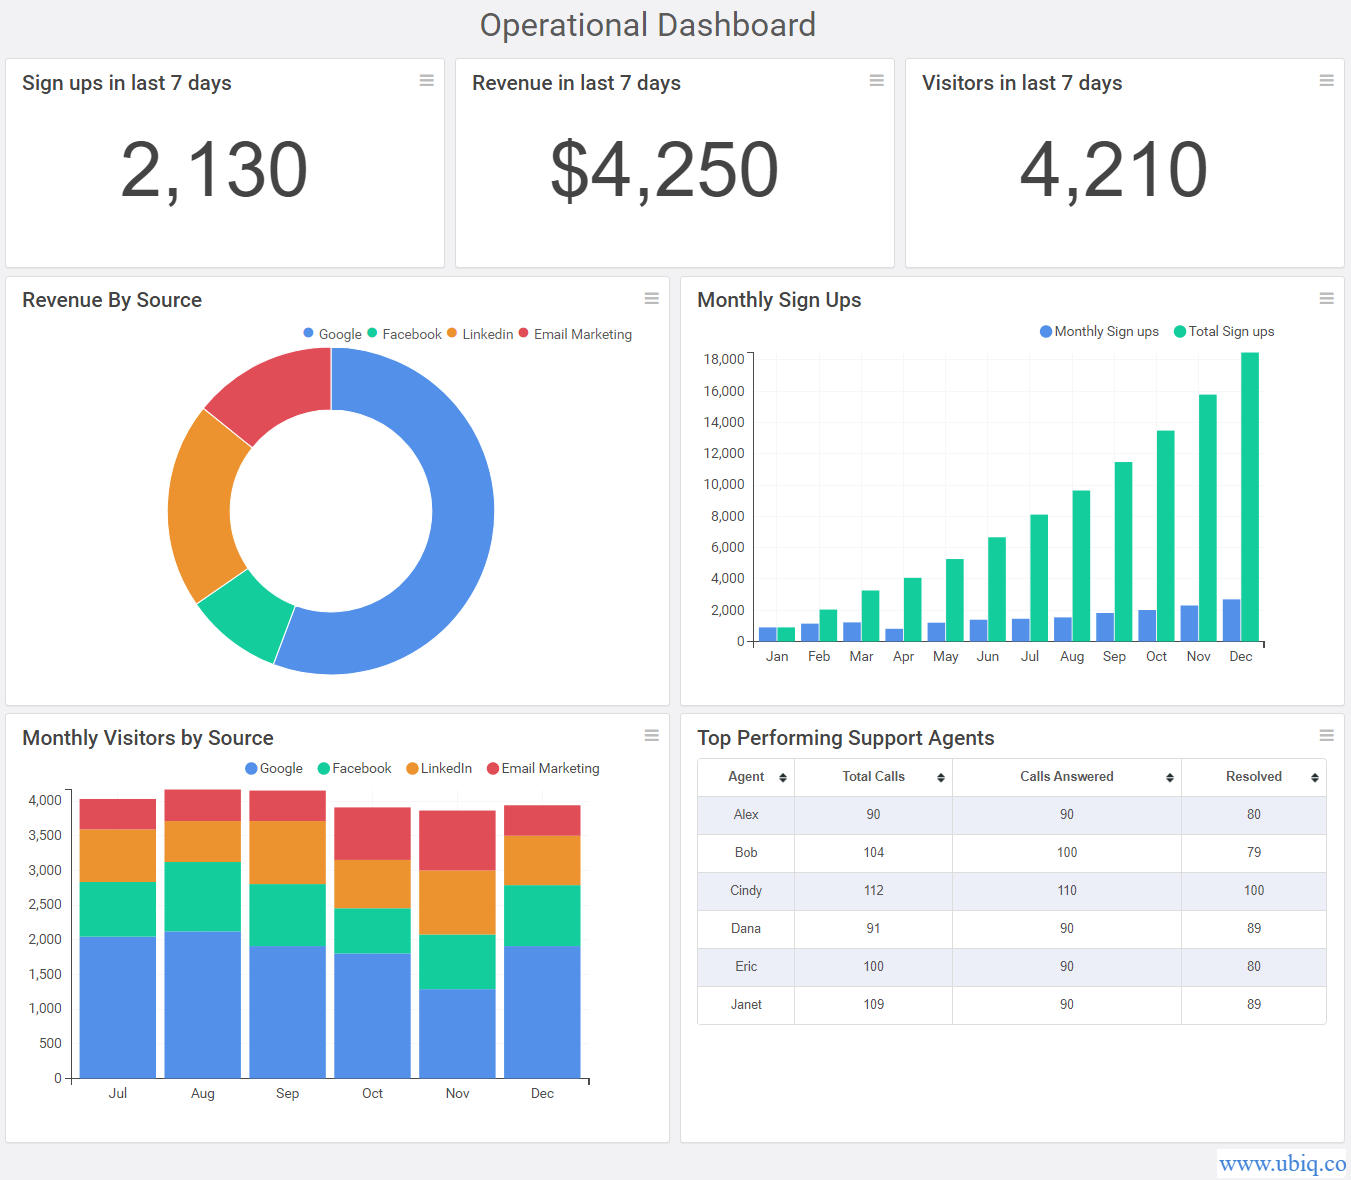
Operational Dashboards make it easy to monitor key operational KPI and metrics about your business, department, or project, and improve business operations. Here’s how to create operational dashboard for your business.
What is an Operational Dashboard?
Operational metrics dashboard gives you at-a-glance status of your business, projects & departments. It contains operational KPIs and metrics that you might need to monitor on a daily/weekly/monthly basis. It is useful for monitoring the performance of your overall business, or one or more departments, or even specific projects. It is important to note that operational dashboards contain fast-changing metrics & graphs, that are relevant to operational managers and team. They don’t contain high-level numbers found in Strategic dashboards, and they are not data heavy like Analytical dashboards.
Bonus Read : Top 5 CRM KPI Metrics for Businesses
How to Use Operational Dashboard
Operational dashboards are meant to give users a quick glance about the vital stats of a specific project/department/business area they are working on. So it is helpful to review operational dashboard daily/weekly and share it with your team. This will help your team understand where they stand with respect to their goals, and also identify & fix problems upfront.
How to Create Operational Dashboard For Your Business
Here are the steps to create operational dashboard for your business.
1. Identify the Target Audience
One of the most important steps to create operational dashboard is to clearly understand who will use it, and why.
If your operational dashboard is meant for a specific project, then its project manager and team members will most likely be its audience. If it is meant for a department, then the department head and a few senior team members may need your dashboard.
So understand who is the target audience for your operational dashboard.
Bonus Read : Top 5 Social Media Marketing KPI Metrics
2. Identify the Operational KPI metics
Once you have identified the target audience for your dashboard, conduct 2-3 rounds of meetings and interviews with them to understand the following
- Why do they need this dashboard
- How will they use it
- How will your dashboard help them do their jobs better
- How frequently will they review your dashboard – daily, weekly?
- What reports do they use at present to measure performance
- What metrics are they tracking at present
- What new KPI metrics would they like to start tracking
Document these dashboard requirements and take a sign off from your target audience and key stakeholders for your reporting project.
Bonus Read : Top 5 Email Marketing KPI Metrics for Email marketers
3. Determine data sources
Determine the data sources required for each KPI metric on your operational metrics dashboard. If you need new data sources for some of the new metrics, communicate it to the project stakeholders.
Also, clearly understand how each metric is being calculated, to avoid mistakes. Also, make sure you have clearly identified all assumptions and caveats, if any, associated with KPI metrics.
You will need to mention them as footnotes in your dashboard.
Bonus Read : Top 5 Inventory Management KPI Metrics
4. Design Dashboard Mockup
Design operational dashboard mockup with all your operational KPI metrics, share them with your target audience and project stakeholders for their feedback.
In your mockup, organize your KPI metrics using a top-down approach, into 3 levels. Place the most important and urgent KPI metrics at the top.
Keep the trends and distributions in middle level. Display granular details such as tables, in the bottom level.
Also, place related KPI metrics next to each other so that it is easy for users to understand relations, draw comparisons and get insights.
Also, choose the right visualization for each KPI metric depending on what you want to show in it.
Once you a get a sign off about your dashboard mock-up, you can go ahead and build operational dashboard using a dashboard software. Here’s a sample operational dashboard built using Ubiq.

Ubiq makes it easy to visualize data in minutes, and monitor in real-time dashboards. Try it Today!
Sreeram Sreenivasan is the Founder of Ubiq. He has helped many Fortune 500 companies in the areas of BI & software development.