CRM KPI metrics make it easy to measure performance of customer relationship management, sales and marketing strategy for your business. Here are the top 5 CRM KPI metrics for businesses that you must monitor regularly.
Top 5 CRM KPI Metrics for Businesses
Here are the key CRM KPI metrics that you must track regularly.
1. Customer Lifetime Value
Customer Lifetime Value is the average total revenue your business receives from your customers as long as they continue to do business with you.
It is one of the most important CRM KPI metrics as it tells you how much average revenue to expect from your customers, and accordingly assign sales and marketing budget for customer acquisition.
If your customer lifetime value is low then you need to investigate if it is because of low pricing or low retention and take appropriate steps to fix the problem.
You can even measure separate customer lifetime value for each customer segment to allocate separate budgets accordingly.
Bonus Read : Top 5 Social Media Marketing Metrics
2. Customer Acquisition Cost (CAC)
Customer Acquisition Cost is the average total cost incurred to acquire each customer. CAC is one of the most popular CRM KPI metrics as it tells you much it costs to acquire each customer.
Make sure you take into account all fixed (e.g salary, software licenses) and variable costs (e.g travel, dining) incurred in sales & marketing activities, while calculating CAC.
Customer Acquisition Cost = Total Cost incurred to Acquire customers in 1 month / No. of customers acquired in 1 month
If your CAC is high, then you may want to cut down on unnecessary expenditure for customer acquisition. Also, you may want to increase pricing to justify the value in your product/service.
Bonus Read : Top 5 Email Marketing KPI Metrics
3. Churn Rate
Churn Rate (also known as customer turnover or customer attrition) measures the percent of your customers that leave your business every month.
Churn Rate = (No. of customers at beginning of month – No. of customer at end of month) *100/No. of customers at beginning of month
Let’s say you have 100 customers at the beginning of your month, and only 95 customers at the end of the month.
When we subtract 95 from 100, we get the result as 5. Divide this result with no. of customers at the beginning of month, that is, 100.
So, you have lost 5 customers, that is, your business’ churn rate is 5%.
Bonus Read : Top 5 Inventory Management KPI Metrics
4. Net Promoter Score (NPS)
Net Promoter Score measures the customers satisfaction for your business. It tells you how likely your customers are to recommend your products/services to others.
NPS score is generally measured on the scale of 0-10 – 0-6 means ‘Not likely to recommend’, 7-8 means ‘May recommend’ and 9-10 means ‘Very Likely to Recommend’.
You can easily calculate NPS score by sending customer survey emails. Ask your customers to rate your business on a scale of 0-10, 10 being most likely and 0 being least likely. Reach out to customers who are ‘Not likely to recommend’ and ask them how you can improve your products/services. Also compare your scores with those of your competitors to see if you need to improve a lot.
Bonus Read : Top 5 SaaS KPI Metrics You Need to Monitor
5. Conversion Rate
Conversion rate is the percent of prospects who have performed a specific action, such as scheduling a demo, signing up for free trial, used your product/service at least once, made a payment, etc.
It is important to measure conversion rate at every stage of your sales & marketing funnel to find out where leads are dropping off the most and fix the issue, to convert more prospects into customers.
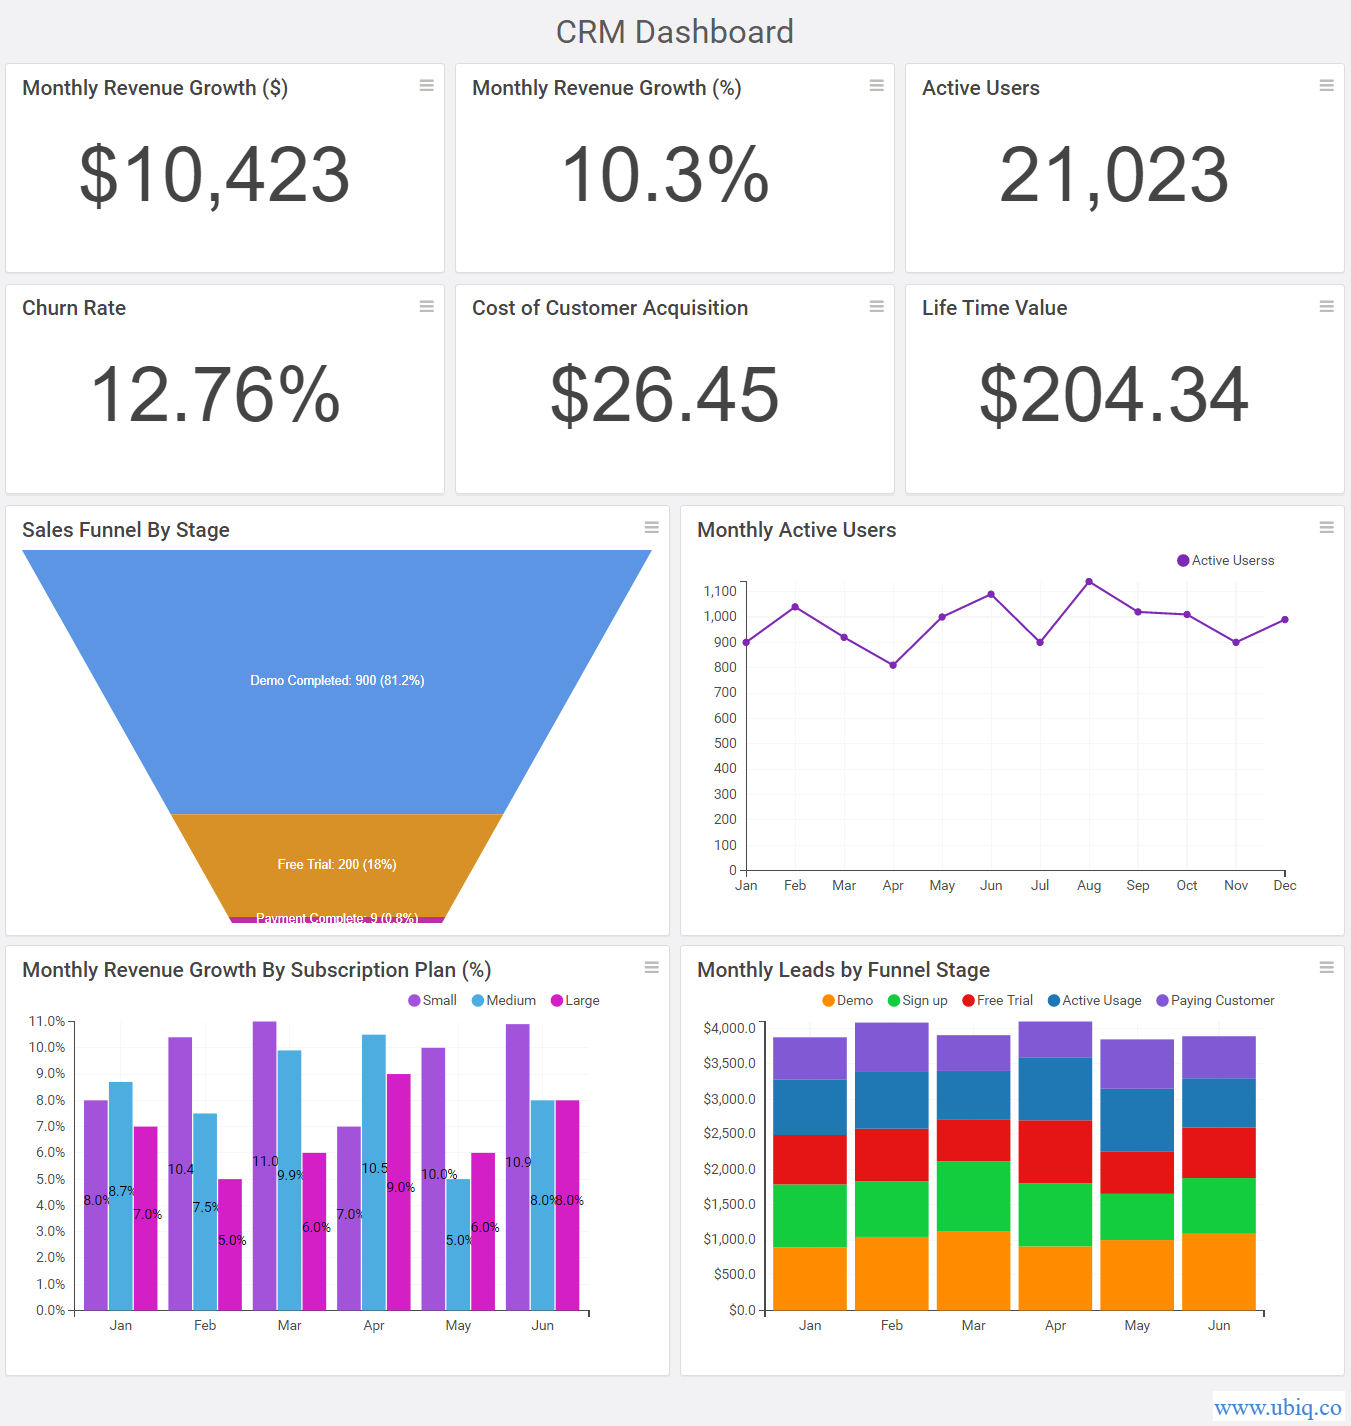
Track these CRM KPI metrics in a dashboard and regularly review with your team. Here’s an example of a CRM KPI dashboard created using Ubiq.

Although there are many CRM KPIs and metrics, the above ones matter the most.
Hopefully, the above CRM KPI metrics will help you measure and improve sales & marketing campaign strategy for your business.
Ubiq makes it easy to visualize data in minutes, and monitor in real-time dashboards. Try it Today!
Sreeram Sreenivasan is the Founder of Ubiq. He has helped many Fortune 500 companies in the areas of BI & software development.