Build dashboards & reports in minutes

  • Features
  • Pricing
  • Blog
  • What is Ubiq
  • Free Trial

Top 5 Dashboard Design Best Practices & Principles

March 11, 2020March 23, 2021 Sreeram Sreenivasan Dashboards
dashboard design best practices

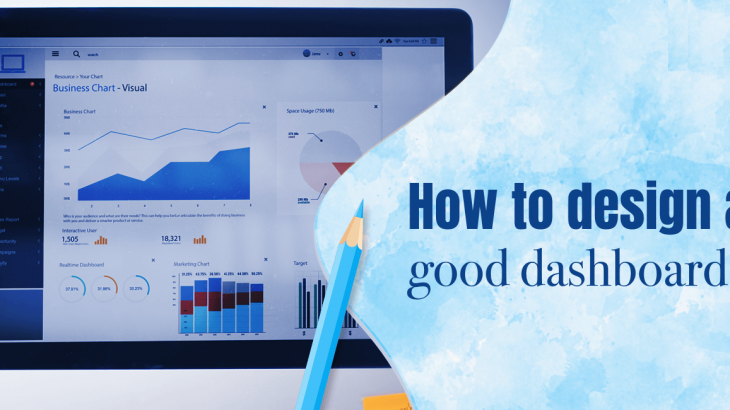
Well-designed dashboards are intuitive & insightful. Here are 5 key dashboard design best practices & principles you can use.

Continue reading


Key Financial Charts and Graphs for Every Business

March 6, 2020August 10, 2020 Sreeram Sreenivasan Data Visualization
financial charts and graphs

Financial KPIs help you monitor the health of your business. Here are the key financial charts and graphs every business must monitor regularly.

Continue reading


Top 5 Growth KPIs Every Business Must Track Regularly

March 4, 2020August 10, 2020 Sreeram Sreenivasan KPI
top 5 growth kpis every business must monitor

It is important to track the right growth metrics for your business. Here are the top 5 growth KPIs every business must track regularly.

Continue reading


How to Build Metrics for Business Dashboard Reporting

February 28, 2020January 3, 2021 Sreeram Sreenivasan Dashboards
how to build metrics for business dashboard

Metrics are the building blocks of business dashboards. Here’s how to build metrics for business dashboard reporting.

Continue reading


Key Business Intelligence Requirements for Every Business

February 27, 2020August 10, 2020 Sreeram Sreenivasan Business Intelligence
Key Business Intelligence Requirements

Business Intelligence projects’ success depends on its requirements and scope. Here are the key business intelligence requirements for every business.

Continue reading


5 Tips to Build Better Business Dashboards

February 21, 2020August 10, 2020 Sreeram Sreenivasan Dashboards
build better business dashboards

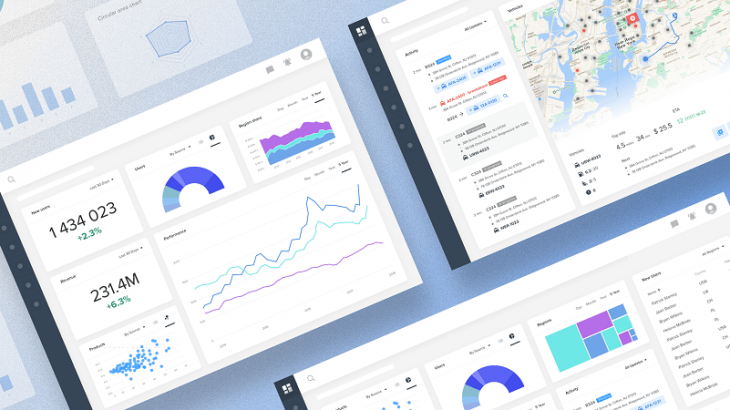
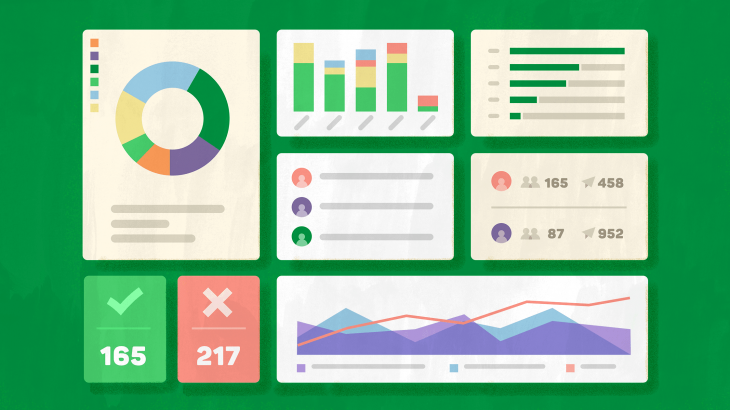
Here are top 5 tips to build better business dashboards to get better insights and make better decisions.

Continue reading


Types of Business Dashboards You Must Know

February 19, 2020August 10, 2020 Sreeram Sreenivasan Dashboards
types of business dashboards

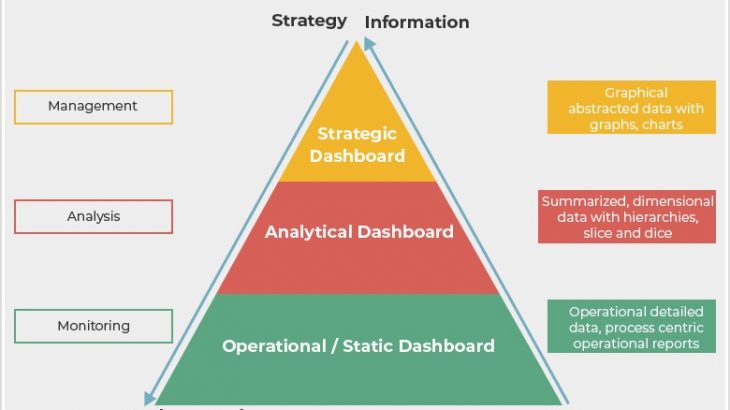
Choosing the right business dashboards helps you get insights quickly. Here are the 3 types of business dashboards you must know while building dashboards for your business.

Continue reading


Top 6 Customer Service KPIs You Must Monitor Regularly

February 17, 2020August 10, 2020 Sreeram Sreenivasan KPI
customer service kpis

Here are the top 6 Customer Service KPIs you must monitor regularly to improve customer satisfaction and user retention.

Continue reading


How to Choose the Right Data Visualization

June 30, 2015September 14, 2020 Sreeram Sreenivasan Data Visualization
how to choose the right data visualization

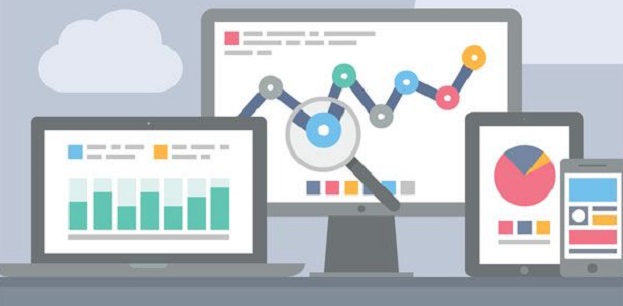
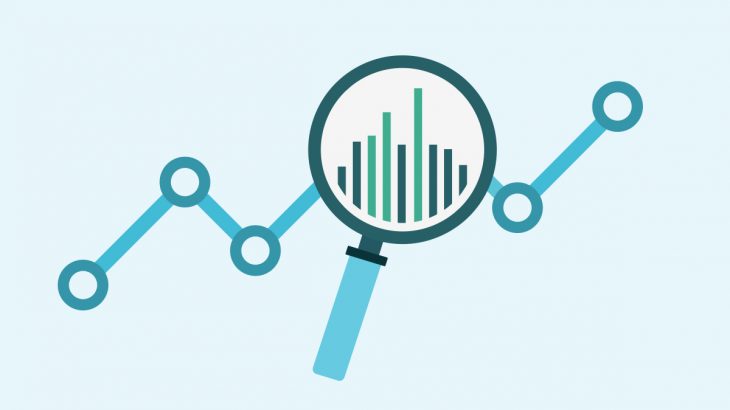
Here’s how you can choose the right data visualization. Choosing the right chart for your data helps you transform data into meaningful insights.

Continue reading


Page 8 of 8« First«...45678

About Us


Ubiq is a business intelligence & reporting software. Build business dashboards, charts & reports in minutes. Get insights from data quickly. Try it for free!


Data Reporting
  • MySQL Reporting Tools
  • PostgreSQL Reporting Tools
  • Online Reporting Tools
  • Web Reporting Tools
  • Redshift BI Reporting
  • SQL Reporting Tools
Business Intelligence
  • BI Solution
  • BI Reporting Software
  • MySQL BI Reporting Tools
  • Self Service BI
  • SaaS BI
Data Visualization
  • Data Visualization Tools
  • Data Analysis Tools
  • Visual Analytics
  • MySQL Charts
  • MySQL Graph Generator
  • MySQL Report Builder
  • Online Report Generator
  • Redshift Data Visualization
Dashboards
  • Dashboard Builder
  • Dashboard Reporting Software
  • Dashboard Creator
  • KPI Dashboard Software
Quicklinks
  • Contact Us
  • Docs
  • Jobs
  • BI Blog
  • Database Blog
  • Tech Blog
Resources
  • Security
  • Privacy
  • T&C
  • Sitemap
dazzling Theme by Colorlib Powered by WordPress