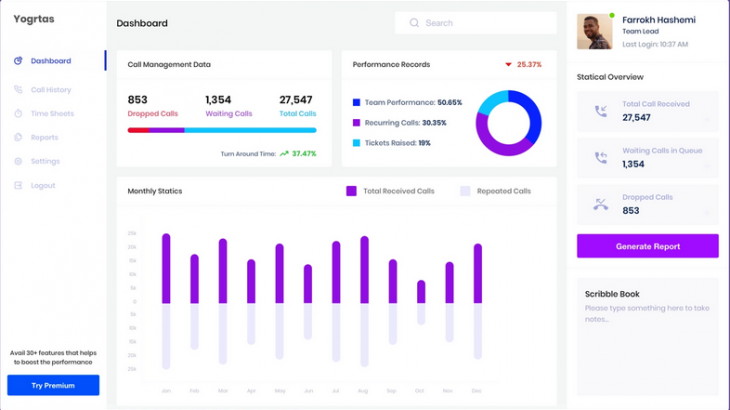
Call Center Dashboard Reporting & Analytics makes it easy to monitor call center performance and customer service KPI metrics. Here are the top 5 call center dashboard reporting & analytics tips for you.
Call Center Dashboard Reporting & Analytics makes it easy to monitor call center performance and customer service KPI metrics. Here are the top 5 call center dashboard reporting & analytics tips for you.
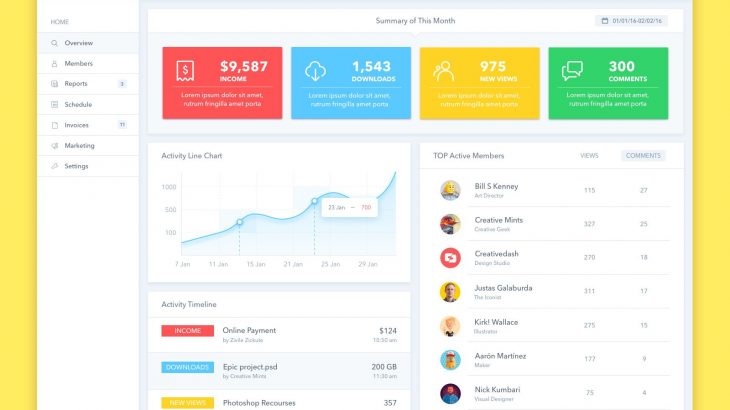
Key dashboard features make your business dashboards effective. Here are the top 5 dashboard features for business dashboards to get insights from data.
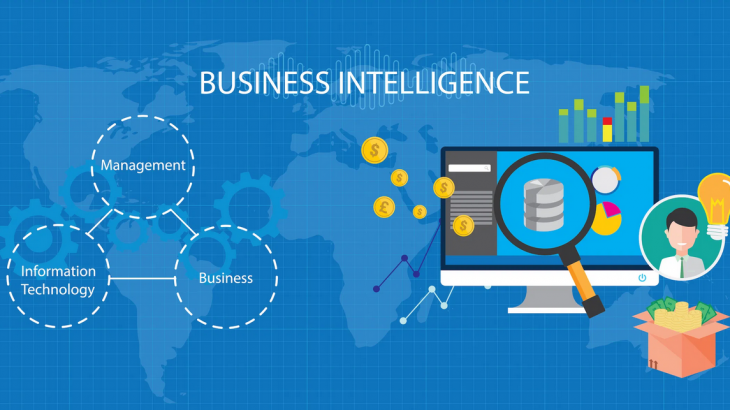
BI tools & platforms make it easy to get insights from data and make better decisions. Here’s how to choose the best business intelligence software for your business.
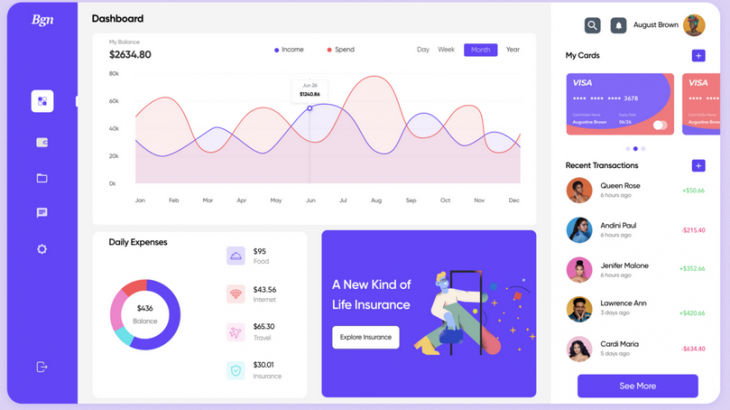
Financial Dashboards & Reports give at-a-glance status of financial information about your business. Here are the key benefits of Financial dashboards & reports, along with Financial KPIs & metrics.

CTO dashboards & reports make it easy to monitor technology infrastructure. Here are the key benefits of CTO dashboards & reports, along with CTO KPIs & metrics.
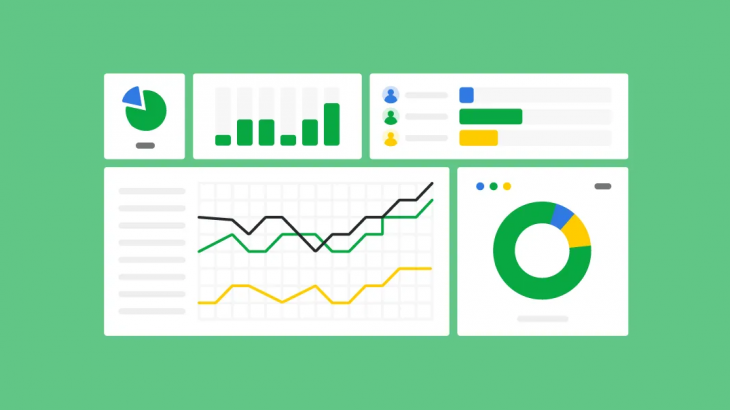
Operational Dashboards help you measure operational performance and grow business. Here’s how to create operational dashboard for your business.

CRM KPI Metrics help measure performance of CRM, Sales and Marketing strategy. Here are the key customer relationship metrics to track regularly.

Social Media Marketing KPI metrics let you measure performance of social media marketing campaign strategy. Here are the top 5 social media marketing KPI metrics you must track.
Email marketing KPI metrics help you measure email marketing performance for campaigns. Here are the top 5 email marketing KPI metrics for email marketers you must track regularly.
SaaS KPI Metrics help you measure performance of SaaS business and make better decisions. Here are the top 5 SaaS KPI Metrics you should monitor regularly.