SaaS KPI metrics make it easy to monitor performance of your SaaS business, identify growth areas and make better decisions. Here are the top 5 SaaS KPI metrics you must monitor regularly.
Top 5 SaaS KPI Metrics You Should Monitor
Here are the top 5 SaaS KPI metrics you must track on a regular basis.
1. Monthly Growth Rate
Monthly growth rate is one of the most important SaaS KPI metrics for every SaaS business. It measures the amount of monthly revenue growth for your business.
Initially, you can begin by measuring monthly revenue and plot it on a bar chart to understand the revenue trends. As your business grows, you can measure percent revenue growth rate as
Revenue Growth rate (%) = (Current Month Revenue – Previous Month Revenue) * 100/ Previous Month Revenue
Revenue growth is more important than tracking monthly signups or growth in sign ups because most of signups never turn into paying customers.
Bonus Read : How to Design a Dashboard for Your Business
2. Burn Rate
Burn Rate is also one of the most popular SaaS KPI metrics. Just as it is important track monthly revenues, it is equally important to track monthly expenditure for your SaaS business.
Burn Rate is the amount of capital a business spends every month. If you have a high burn rate, then it will eat into your revenue and force your SaaS business to quickly run into losses.
While calculating burn rate, make sure that you have carefully accounted for all kinds of expenses incurred for your business. Otherwise, your business will be losing money without your knowledge.
No matter how well your business is doing, it is a good habit to keep a low burn rate and regularly look for ways to cut costs.
Bonus Read : Top 5 Retail KPIs & Metrics to Monitor Regularly
3. Monthly Recurring Revenue (MRR)
Since SaaS business is dependent on monthly subscription revenue, it is important to keep an eye on monthly recurring revenue (MRR).
It is a very useful indicator of upgrades, renewals and churn on a monthly basis.
Comparing Monthly recurring revenue and burn rate will give you a good idea of how well your business is doing.
While calculating monthly recurring revenue, ensure that you are counting only the money deposited in your bank account. Avoid including long-term contracts and receivables that have not been realized yet.
Bonus Read : Key Dashboard Design Principles for Successful Dashboards
4. Customer Acquisition Cost (CAC)
Customer Acquisition Cost is the average total cost incurred to acquire each customer.
Customer Acquisition Cost (CAC) = Total cost to acquire customers in a month / Number of customers acquired in a month
While calculating CAC, make sure you include all expenses (marketing cost, sales demo, salaries, overheads, etc) directly related to customer acquisition.
This will give you an idea of how much money you are spending to acquire each customer. Compare this with the average revenue per user (ARPU), and you can determine if your customers are profitable or not.
If the average revenue per customer is less than CAC, it means you are spending more per customer than the revenue you get from them. So your company might quickly run into losses.
In such cases, you may want to cut back on your marketing/sales expenses or increase prices to ensure that each customer is profitable.
Bonus Read : How to Create Marketing Dashboard
5. Lifetime Value (LTV)
Lifetime Value is the average revenue generated per customer over their lifetime. The simplest way to calculate LTV is to multiply average subscription value by average number of renewals (Customer Lifetime)
LTV = Average Monthly Recurring Revenue Per Customer x Average Number of Renewals Per Customer
LTV tells you how much average total revenue to expect from each customer. A high LTV indicates that you are attracting the right customers and that customers find value in your product/service.
Bonus Read : How to Create Content Marketing Dashboard
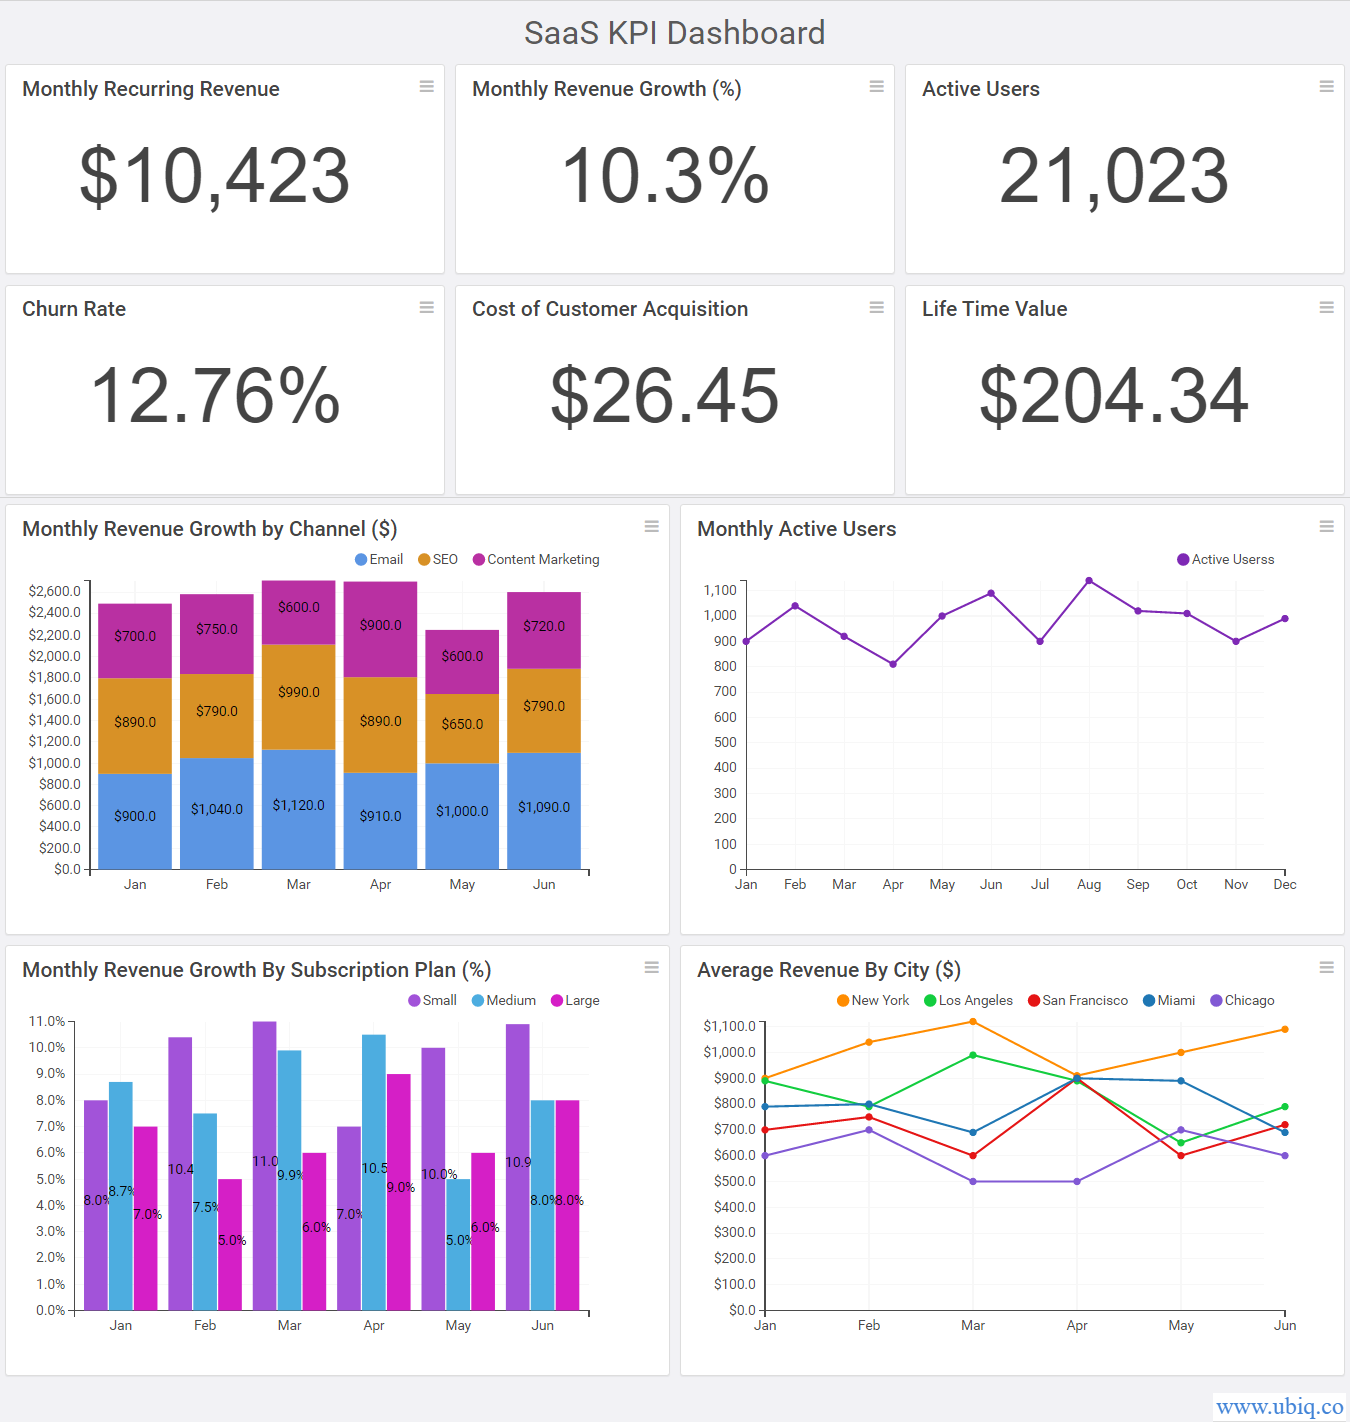
Track these SaaS KPI metrics in a dashboard and regularly review with your team. Here’s an example of a SaaS KPI dashboard created using Ubiq.

There are plenty of SaaS KPI metrics but the above performance metrics matter the most. Monitor them every month and share them with your team to get insights.
Ubiq makes it easy to visualize data in minutes, and monitor in real-time dashboards. Try it Today!
Sreeram Sreenivasan is the Founder of Ubiq. He has helped many Fortune 500 companies in the areas of BI & software development.