Quick Overview
You will need to use Internet Explorer 9 or modern browsers (Chrome, Firefox, Safari, Opera, etc). Older Internet Explorers will need Google Chrome Frame or some other plug-in to support SVG.
When you sign up, you will be sent a mail with activation link. On activation, you will be taken step-by-step through initial setup, analyzing your data & saving views onto your first dashboard. You are provided a free account for a trial period. After the trial period, you can upgrade it to a paid account, to retain your work.
By default, at all times, you are the only admin to your account. In each account, users can create multiple projects. Within each project, users can create multiple data sources, charts & dashboards. You can add other users to your account, if you have a pricing plan that permits multiple users. For each project in your account, you can provide access to these users, and assign them Create/View role.
On login, you will be directed to the user home page:
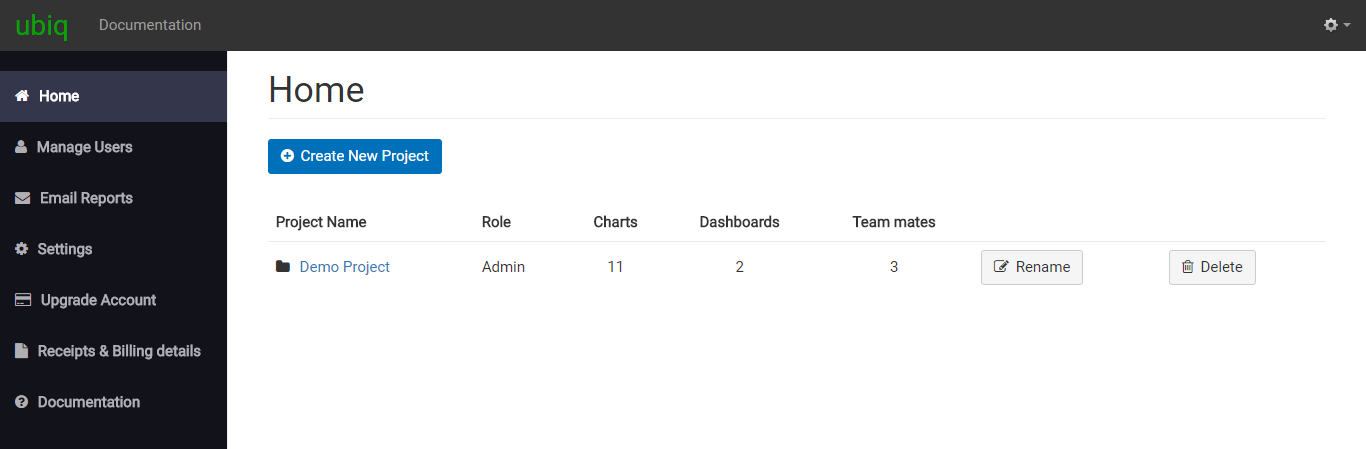
User home page
It lists all the projects that you have access to along with your role in the project, number of charts,dashboards & team mates in each project.
Types of project roles
Admin Role - projects which you have created in your account. You are admin of these projects. Admins have full access to their account including creation of projects, adding data sources, managing team mates & billing. You can create projects by clicking on Create Project button.
Viewer Role - projects which others have created in their account but have provided you Viewer access. Viewers can only view dashboards of the projects to which they have been provided view access.
Creator Role - projects which others have created in their account but have provided you Creator access. Creators can view, add and modify charts & dashboards of the projects to which they have been provided create access. They cannot add new datasources or edit user roles.
You can read more at Access Permissions. You can reach User home page by clicking on Home link on the top navigation bar.
Please note, if your account is de-activated due to non-payment or other reason, you will not be able to view this section until you re-activate your account by making payment.
Project home page
When you click on the name of a project on your home page, you will be directed to the Project's home page.
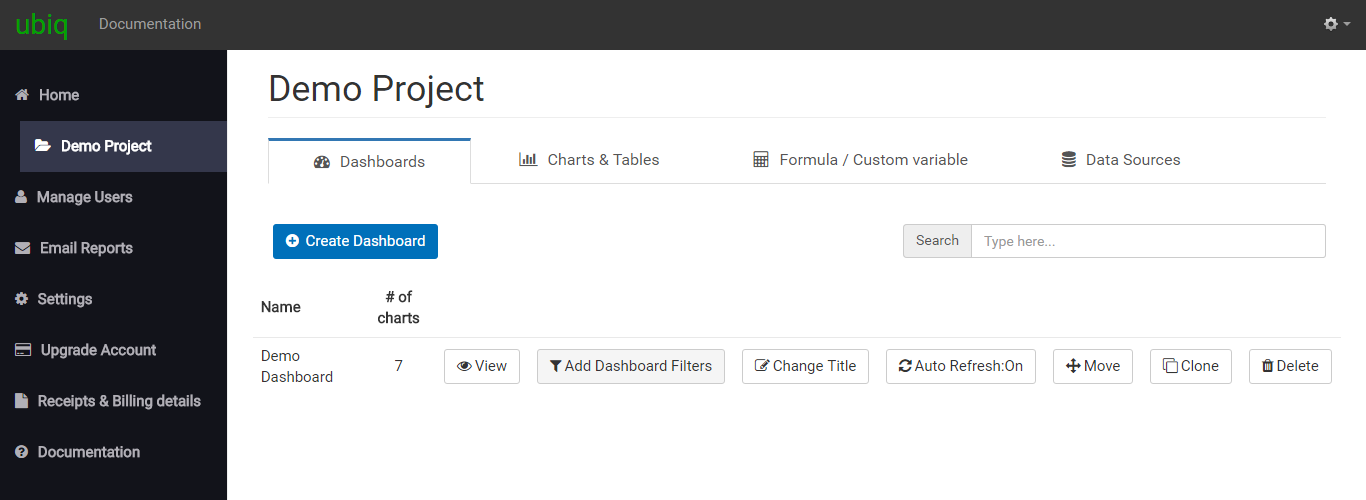
Project home page consists of 4 tabs:
Dashboards - It lists the dashboards that you have added to the project. It can be used to manage (add/edit/remove) dashboards to your project. You can click View to view a dashboard. You can export a dashboard or a chart as Image/PDF/CSV when you are viewing a dashboard.
Charts - It lists the charts that you have added to the project. It can be used to manage (add/edit/copy/remove/share) charts to your project.
Formula/Calculated fields - It lists the the custom fields you have that you have added to the project. You can use these formula/calculated fields in your charts & dashboards
Data Sources - It lists the data sources (database connections) that you have added to the project. It can be used to add/remove data source to your project.
Account Management
On top right corner of user home page, you will see your username with a dropdown. When you click on the dropdown, you will see the following options:
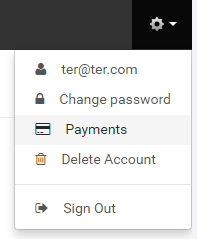
Payments - for making monthly payment
Change Password - for changing user password
Account settings - contains options to manage account users, payments & account deletion.