Website Performance Metrics & KPIs help you measure website performance, improve website speed & user experience. Here are the key website performance metrics you must monitor regularly. You can also use these website analytics metrics for web application performance monitoring.
Key Website Performance Metrics & KPIs to Monitor Regularly
Here are the important website performance metrics you must track in a website metrics report and share with your team.
1. Requests Per Second
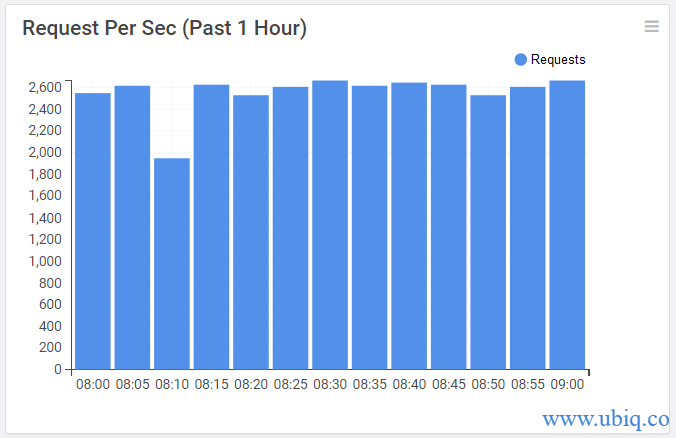
Requests Per Second is one of the most important website performance metrics that measures the number of requests received by your website every second.
As this metric rises, your website’s load will increase and consequently your pages will take more time to load, unless you optimize your website or upgrade your server.
You can monitor live requests per second as a single number.

You can also track total number of requests over time, in a column chart
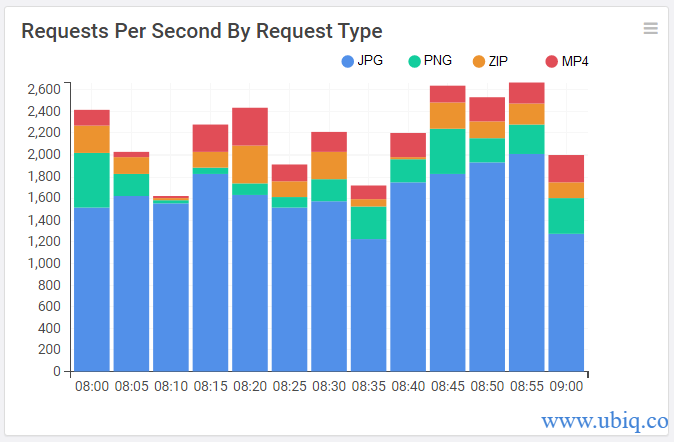
You can also monitor number of requests for each file type such as CSS, JS, HTML, etc to identify bottlenecks.
Bonus Read : What to Include in Executive Dashboard
2. Page Load Time
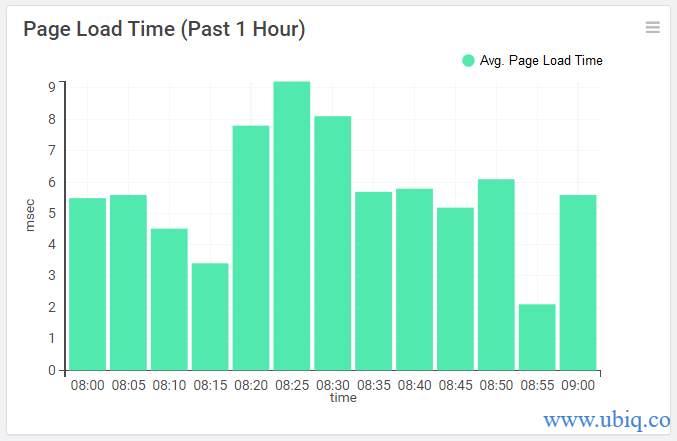
Page Load Time is one of the most popular website performance metrics. It is the amount of time it takes to load a page completely starting from the time a user clicks the link or types the URL of that page, until it is fully loaded in browser.
You can track daily average page load time every day to get an idea of what days of the week your website is loaded heavily.

You can also track average page load time every hour to find out at what times of the day your website gets heavy load.
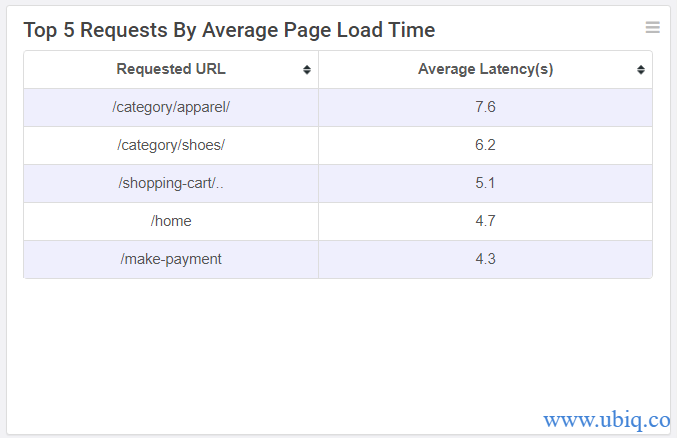
You can even monitor top 5 pages by their average page load time to find out which requests take the most amount of time to load.
Bonus Read : Top Call Center KPIs & Metrics
3. Throughput
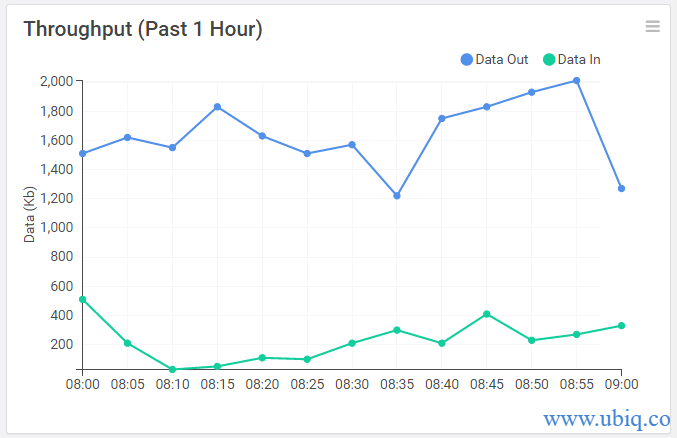
Throughput is one of the most critical website performance metrics that allows you to measure the amount of data received (data in) and sent (data out) by your website per second.
If your website has a high ‘data in’ rate, then it means your website consumes lot of information to process each request. If it has a high ‘data out’ rate, then it means your site is sending bulky responses, which you may want to optimize via compression.
You can monitor average data in & out rates as shown below.
Bonus Read : Key Server Performance Metrics & KPIs
4. Error Rate
It is important to constantly track the number and type of errors returned by your website. You can fix many of them and improve user experience.
When your website throws an error, it will return an error response code such as 404 for ‘page not found’ error, 500 for internal server error, etc.
Track the number of errors on your website as shown below
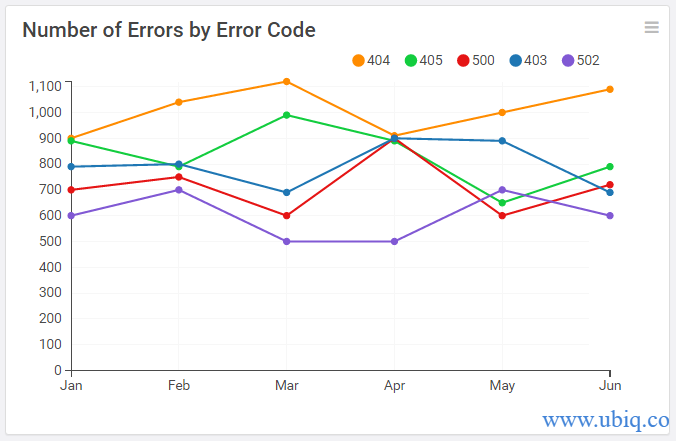
For example, if your website returns many 404 error responses, then use a broken link checker to identify those links and fix them.
Bonus Read : Components of a Successful Dashboard
5. Unique Visitors
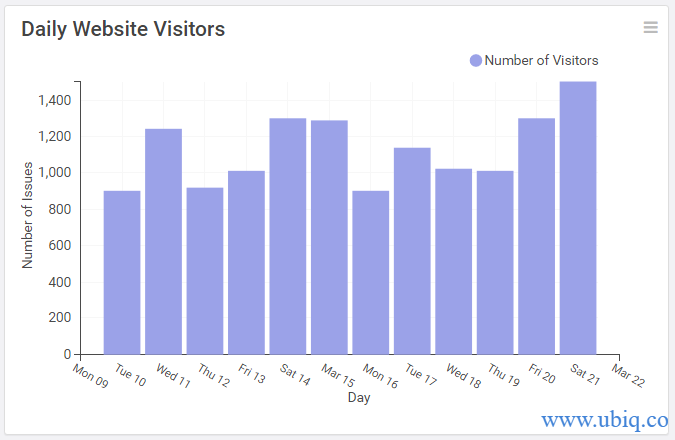
It is also important to keep an eye on the number of unique visitors that visit your website every day/week/month.
You can track overall number of unique visitors as shown below.
You can even track unique visitors by various channels.
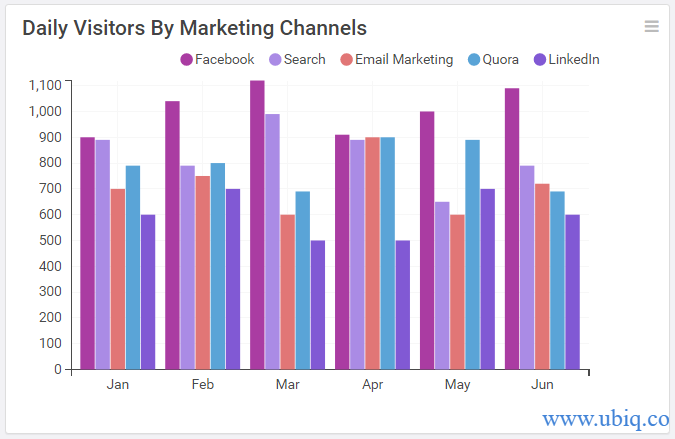
If this metric grows, it means that your marketing strategy is working and your website is attracting more visitors.
6. Conversion Rate
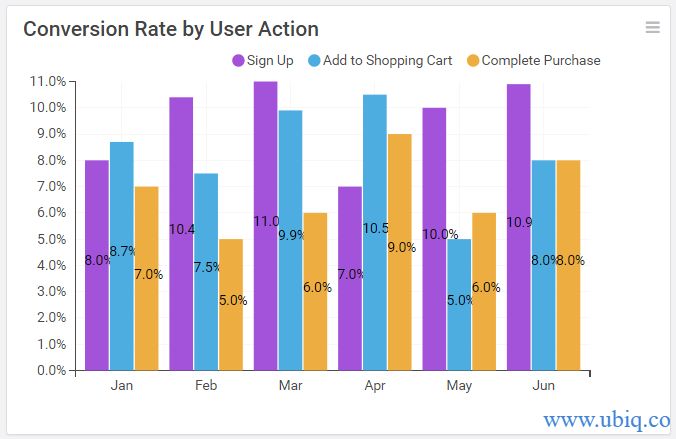
The main objective of every website is to convert its website visitors into paying customers. Conversion rate is the percent of users who have completed a specific action such as signing up on your website, adding a product to shopping cart, completing purchase, etc.
You can track conversion rate for each desired customer action, as shown below
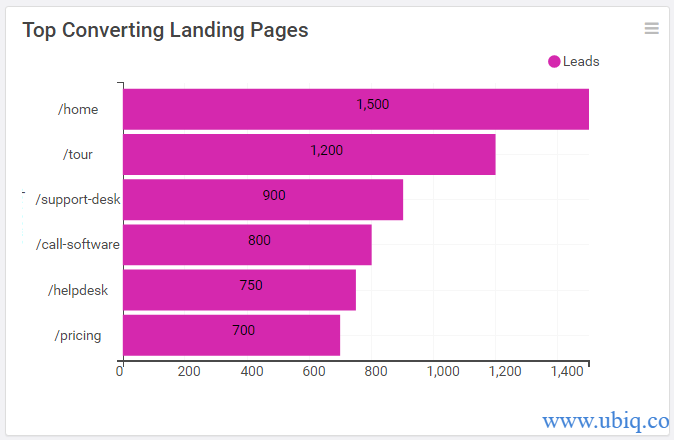
You can also track conversions for each landing page if you want.
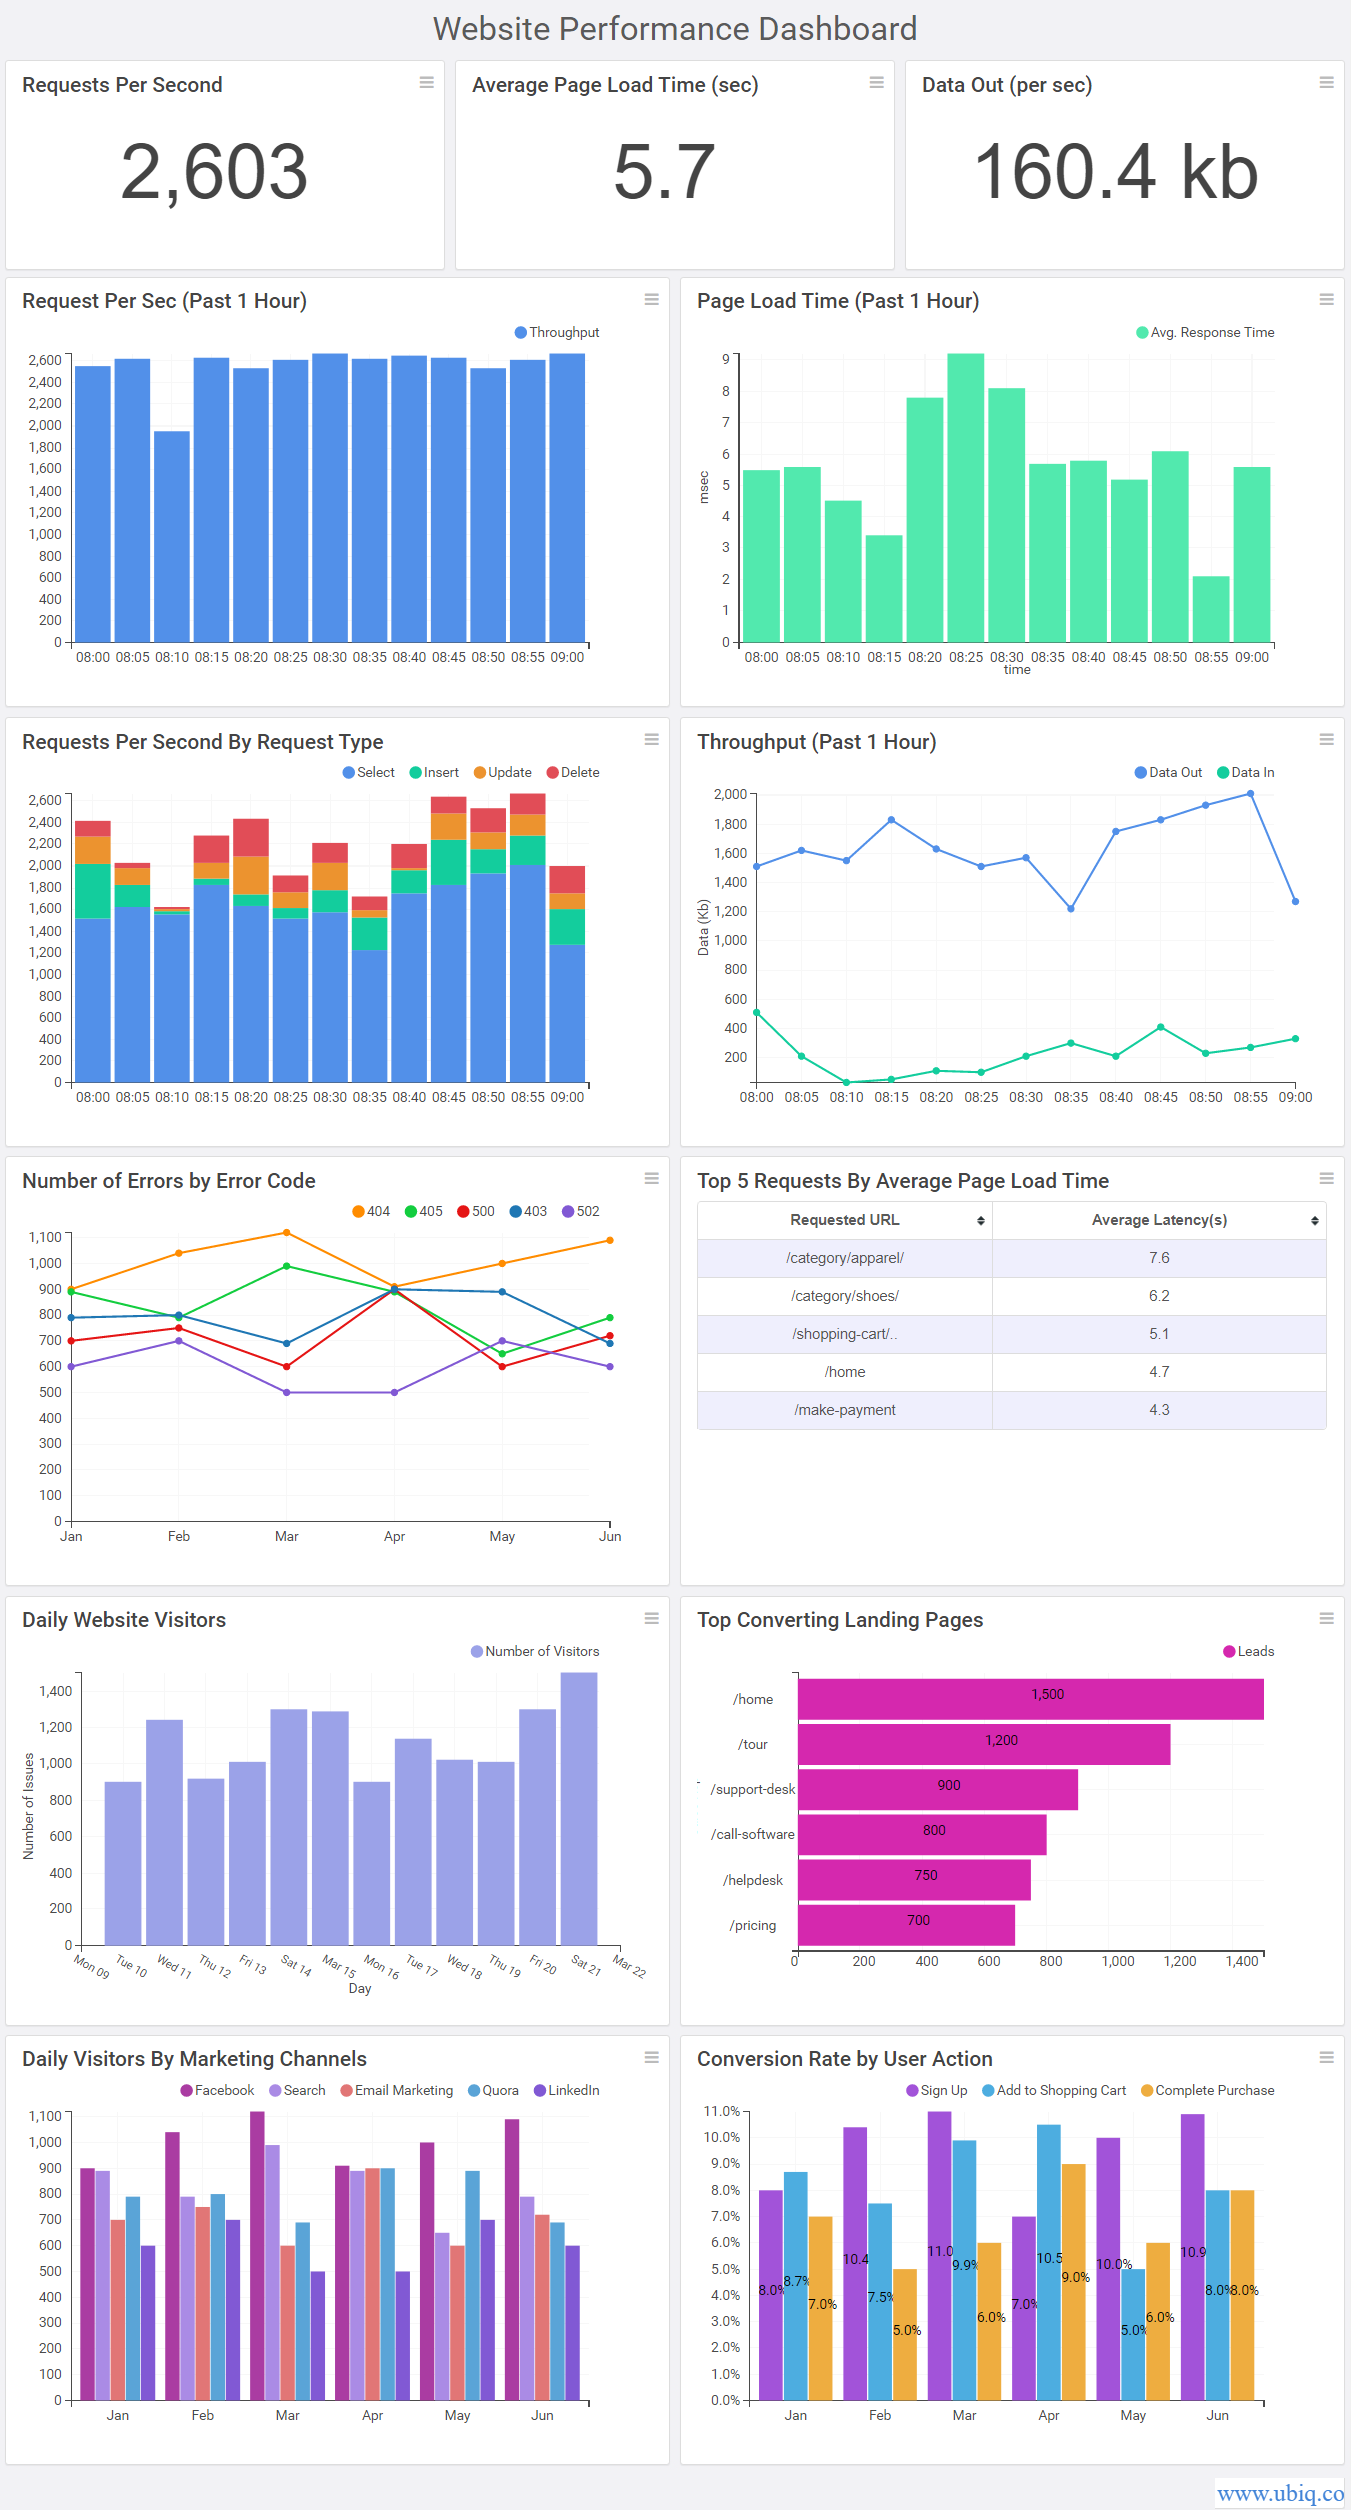
There are many website performance metrics you can track but these are the ones that matter. Monitor these website analytics metrics on a website performance metrics dashboard using a dashboard software like Ubiq, as shown below and share it with your team.
Hopefully, the above-mentioned website performance metrics and KPI examples will help you improve your web application/website performance.
If you want to create website performance monitoring dashboard, reports & charts, you can try Ubiq. We offer a 14-day free trial!
Sreeram Sreenivasan is the Founder of Ubiq. He has helped many Fortune 500 companies in the areas of BI & software development.