Ecommerce Dashboard helps you measure success in ecommerce, and make better decisions. Since there are so many ecommerce metrics to track, you must be wondering, “What Should Ecommerce KPI Dashboard Include?”. Here’s what you should include in your Ecommerce dashboard design.
What Should Ecommerce KPI Dashboard include?
Here are 5 Ecommerce KPI metrics that you should include in your dashboard. Create a dashboard for tracking Ecommerce KPIs & metrics mentioned below.
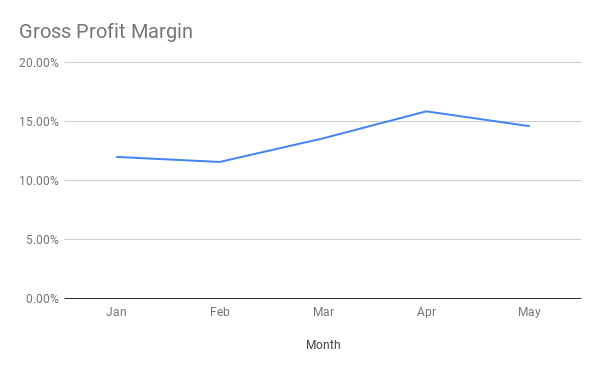
1. Gross Profit Margin
Ultimately, the aim of every business is to maximize profits. So track gross profit margin on your Ecommerce KPI dashboard.
Gross profit margin = (revenue earned – costs of goods sold) ÷ revenue
In the above formula, cost of goods sold should include all costs directly related to your products. Don’t include operating expenses, taxes & interests.
Your gross profit margin is what you are left with after selling your products. It tells you how much profit you make for the products you sell.
You can calculate total gross profit margin as well as gross profit margin for each category, to weed out loss making products from your catalog. You can track it on a line chart using a data visualization software.
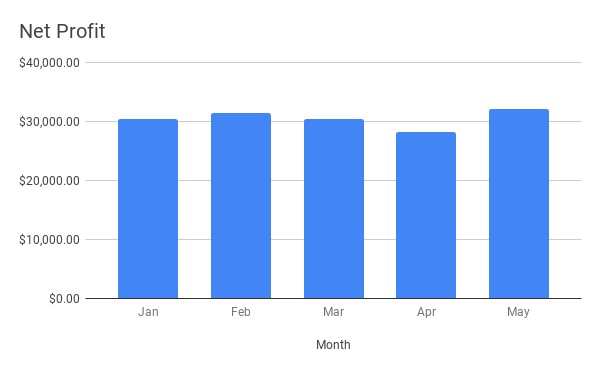
2. Net Profit
Net Profit is the profit you are left with after deducting all expenses from your income.
Net Profit = Total Revenue – Total Expenses
You have to monitor this financial KPI metric carefully, all the time, so that you don’t run out of funds to run your business. Also, you can use a part of net profit to invest back into your business.
Again, you can track overall Net Profit every month, in a column chart using dashboard software
Like Gross Profit Margin, you can break down net profit by product category and marketing channels to determine profitable products and channels respectively.
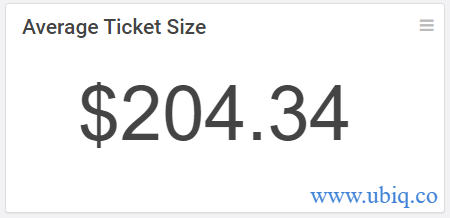
3. Average Order Size
Worth how much does a customer purchase? Average Order Size is one of the most useful metrics on Ecommerce KPI dashboard
Average Order Size = Total Revenue / Total Number of Orders
This growth KPI shows how much money, on an average, a customer spends, while on your website. Compare this with the average marketing spend per customer and you will know if you are overspending in your marketing campaigns.
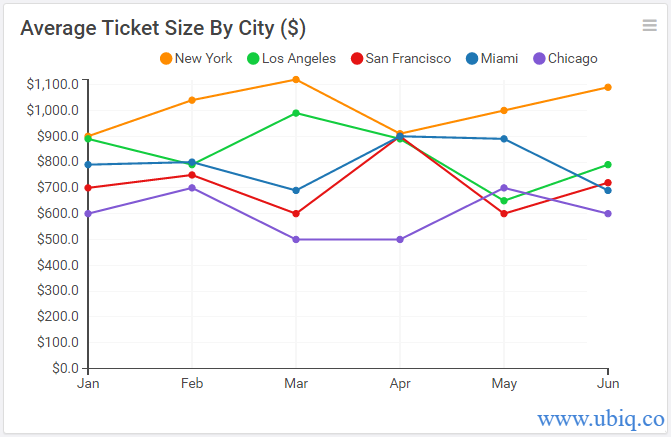
Since an ecommerce website sells various categories of products, across a vast price range, it is more useful to break down average order size for each product category, or even city. This will help you determine whether to increase/decrease marketing budget of each category.
You can track overall Average order size as shown
or monitor average order size across cities, as shown below
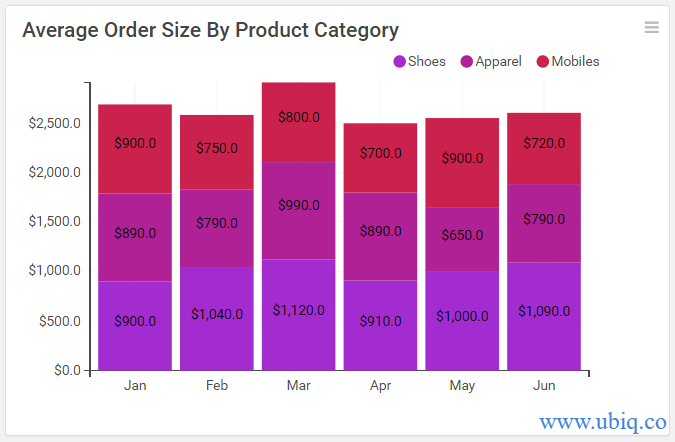
You can even track average order size across product categories, using a BI solution
4. Customer Acquisition Cost (CAC)
How much do you spend to acquire a customer? Customer Acquisition Cost is calculated by dividing total amount spent on acquiring customers over a period of 1 month, divided by total number of customers during that 1 month.
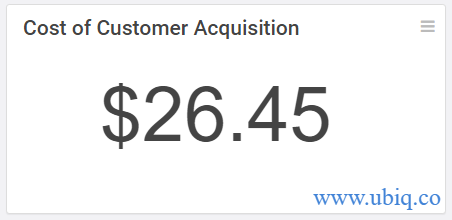
If your cost of acquisition is more than average order size, then you are losing money on every customer, and your business will run into losses quickly. In that case, you can either cut marketing costs, or increase prices of your products.
5. Cart Abandonment Rate
Cart Abandonment rate is one of the most important metrics that an Ecommerce KPI dashboard should include. It stands for the percent of customer that have added items to their shopping cart but abandoned your website just before completing purchase.
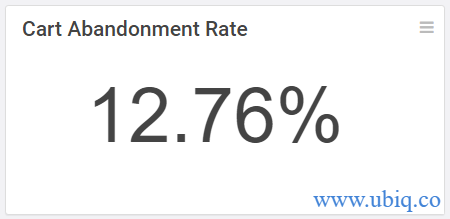
A high cart abandonment rate can indicate problems with checkout experience, such as insufficient payment options, that need attention.
6. Conversion Rate
Conversion rate is the percent of users who complete a desired action, such as signing up for your website, adding product to shopping cart, etc.
You can track conversion rate for each product category to determine which ones need more attention.
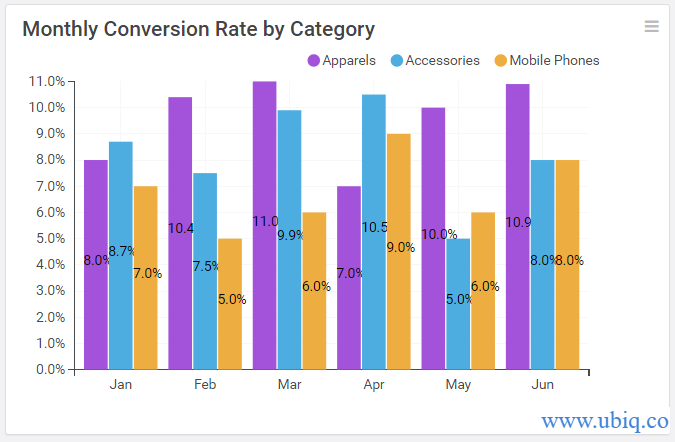
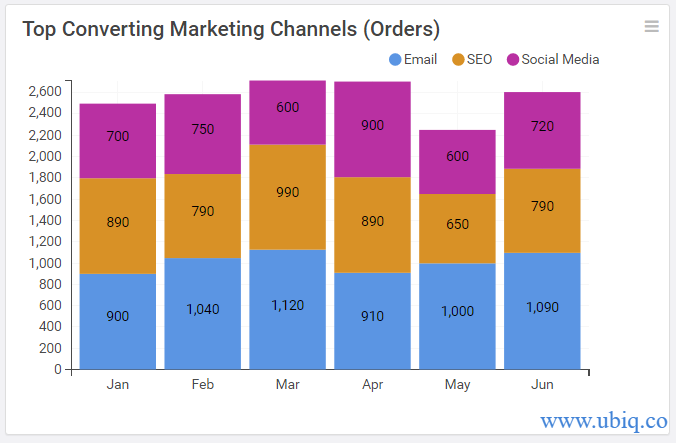
You can even track marketing KPIs such as conversions by marketing channels to determine which ones bring more customers.
There are plenty of Ecommerce KPI metrics to track but we have covered the most important ones, that you must include in Ecommerce KPI dashboard. Unless you track them, your business might go in a wrong direction, and you may not even realize it. So plot them on an Ecommerce KPI dashboard using a dashboard software like Ubiq, as shown below and share them with your team.
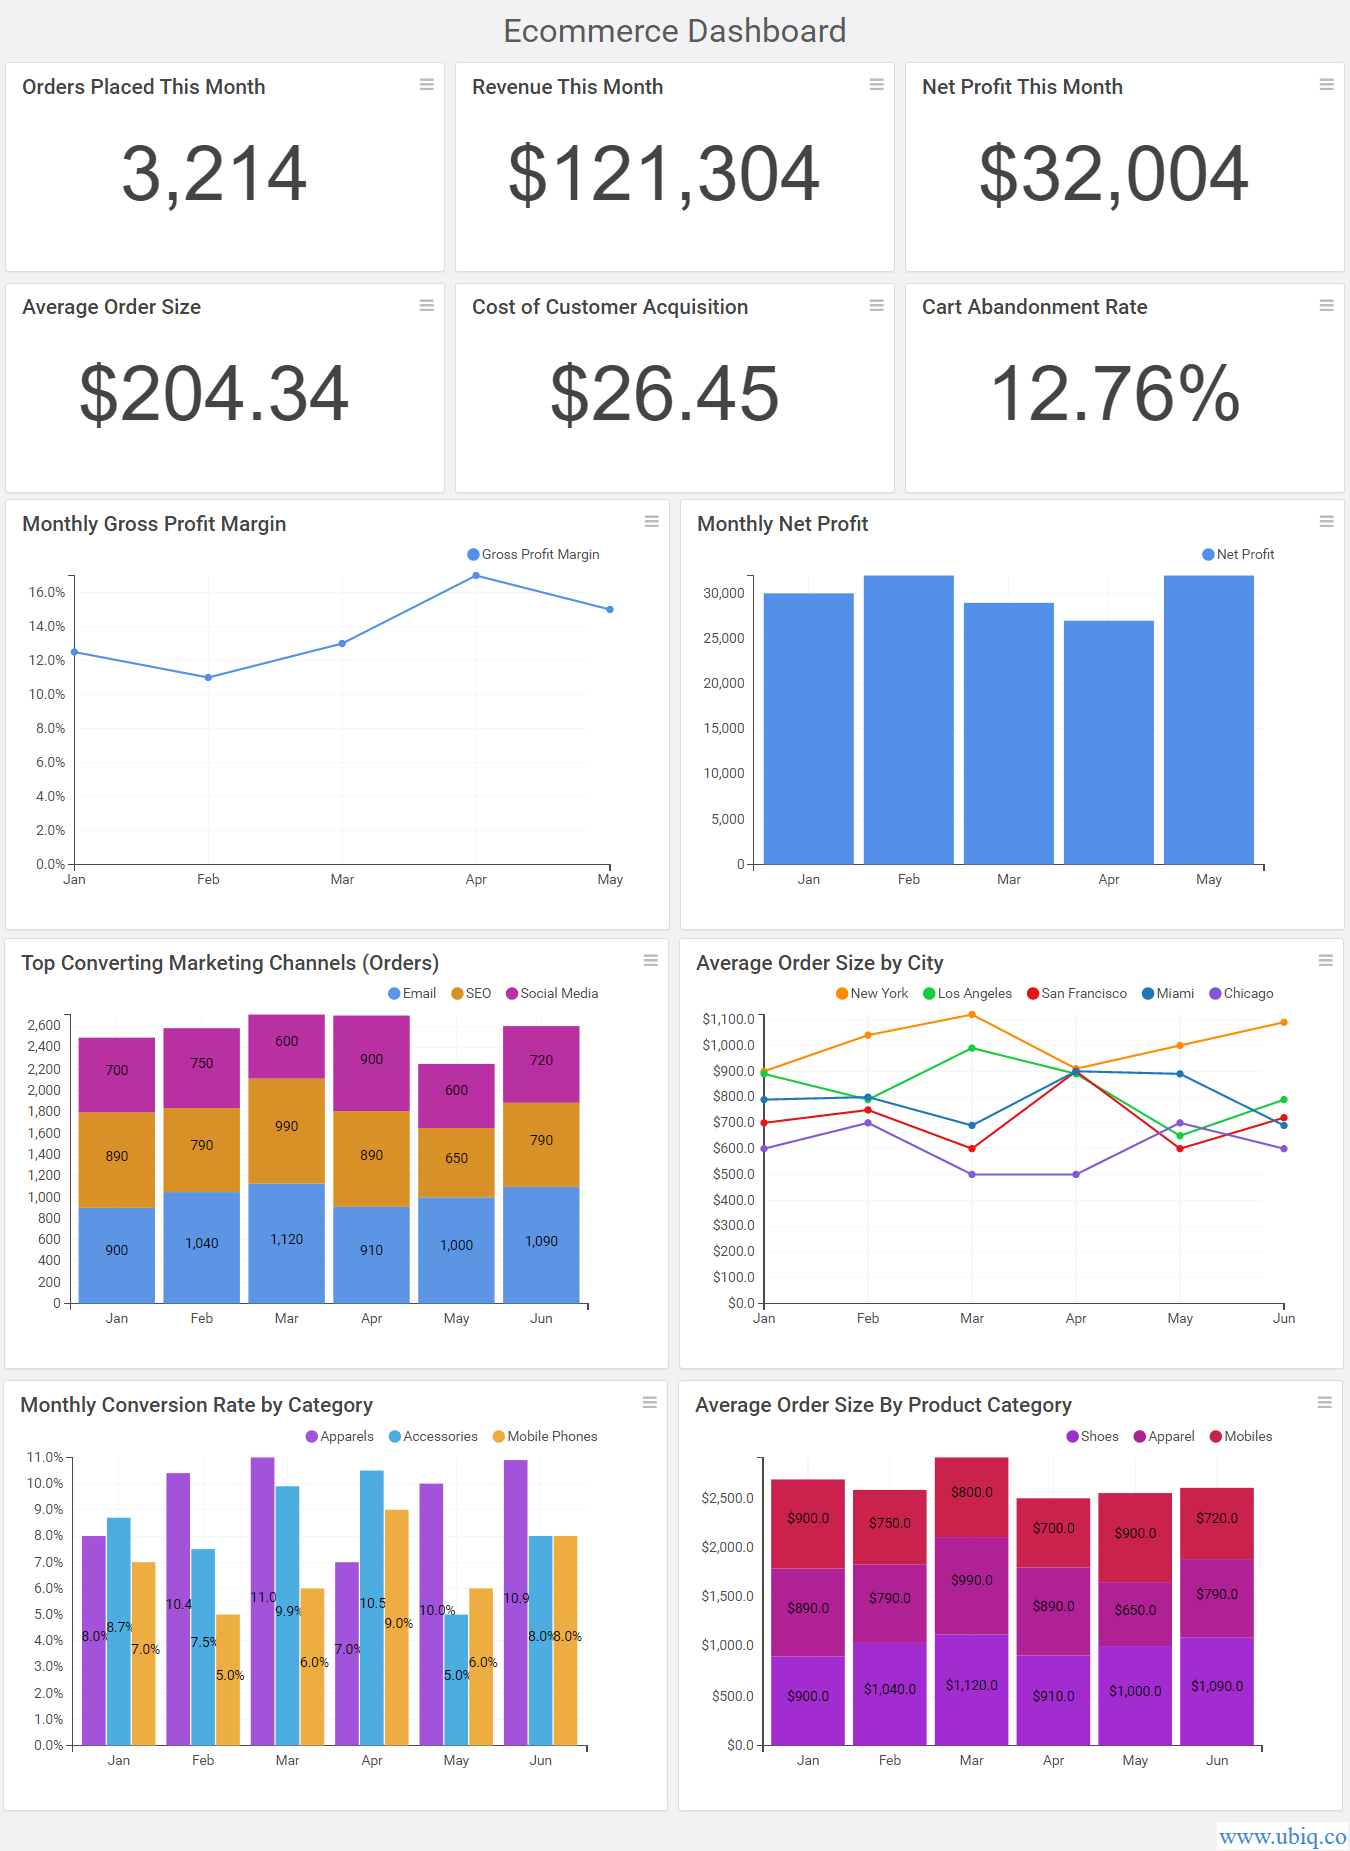
Hopefully, the above-mentioned key ecommerce metrics and KPI examples will help you improve your online business.
If you want to create Ecommerce KPI dashboard, reports & charts, you can try Ubiq. We offer a 14-day free trial!
Sreeram Sreenivasan is the Founder of Ubiq. He has helped many Fortune 500 companies in the areas of BI & software development.