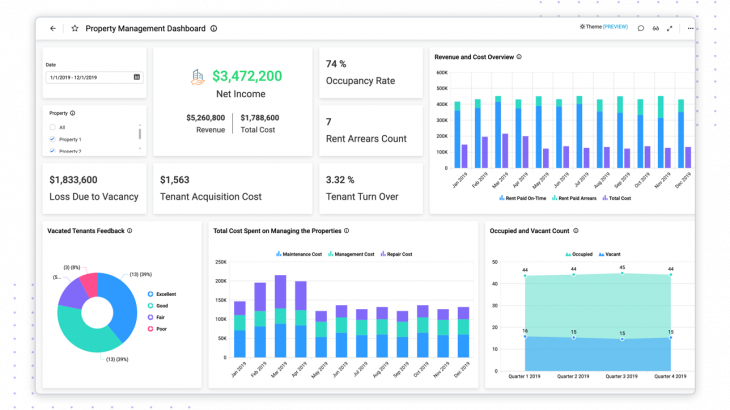
Dashboard software help track KPI metrics and visualize data. Here are the top dashboard software tools.
Dashboard software help track KPI metrics and visualize data. Here are the top dashboard software tools.
SQL Reporting and Dashboard Tools allow you to visualize SQL query results in charts & dashboards, and share them with others.
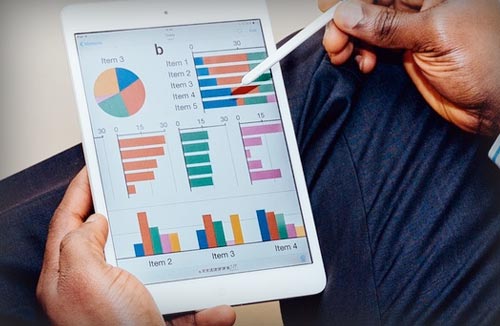
Data Visualization Techniques allow you to design intuitive dashboards and reports. Here are top 5 data visualization techniques to help you get insights from data.
MySQL is a very useful language for data analysis & business intelligence. Here are a few things every business analyst should know about MySQL.
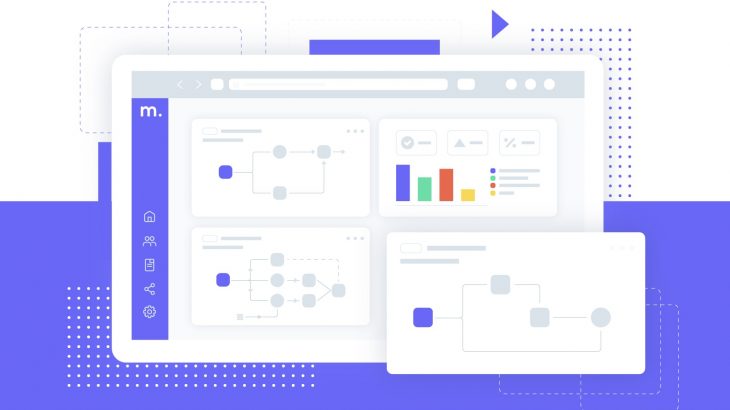
Real time dashboards give you at-a-glance status of your business with latest insights. Here is how to build real time dashboard for your business.
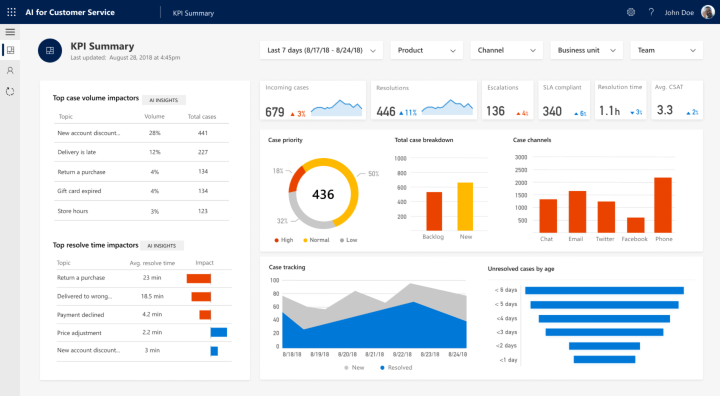
Here is how to build customer service dashboard to monitor customer service performance and improve customer satisfaction.
Here are top 5 Redshift reporting & BI tools to help you explore, analyze, visualize and report data.
Dashboards play an important role in Business Intelligence. Here is how they are vital to every business.
Big data plays a huge role in business growth. Here is the role played by big data in business intelligence.

Data visualization best practices and principles can help you create intuitive graphs & charts. Here are the top 5 data visualization best practices you can apply.