Build dashboards & reports in minutes

  • Features
  • Pricing
  • Blog
  • What is Ubiq
  • Free Trial

financial metrics

Financial Dashboards & Reports : Benefits, Examples, KPIs, Metrics

June 24, 2020February 14, 2022 Sreeram Sreenivasan Dashboards
financial dashboards reports

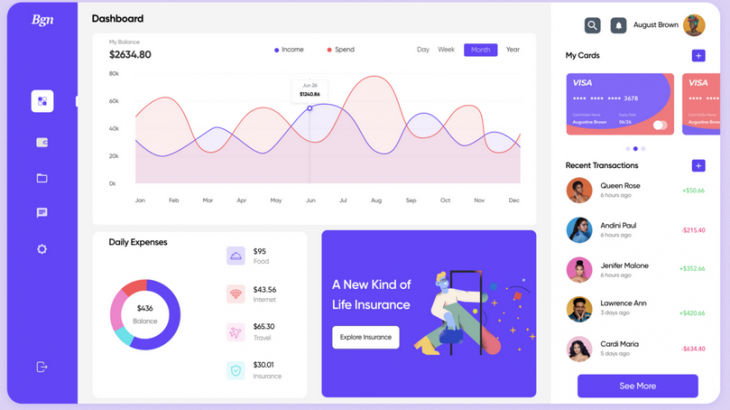
Financial Dashboards & Reports give at-a-glance status of financial information about your business. Here are the key benefits of Financial dashboards & reports, along with Financial KPIs & metrics.

Continue reading


Key Financial Charts and Graphs for Every Business

March 6, 2020August 10, 2020 Sreeram Sreenivasan Data Visualization
financial charts and graphs

Financial KPIs help you monitor the health of your business. Here are the key financial charts and graphs every business must monitor regularly.

Continue reading


About Us


Ubiq is a business intelligence & reporting software. Build business dashboards, charts & reports in minutes. Get insights from data quickly. Try it for free!


Data Reporting
  • MySQL Reporting Tools
  • PostgreSQL Reporting Tools
  • Online Reporting Tools
  • Web Reporting Tools
  • Redshift BI Reporting
  • SQL Reporting Tools
Business Intelligence
  • BI Solution
  • BI Reporting Software
  • MySQL BI Reporting Tools
  • Self Service BI
  • SaaS BI
Data Visualization
  • Data Visualization Tools
  • Data Analysis Tools
  • Visual Analytics
  • MySQL Charts
  • MySQL Graph Generator
  • MySQL Report Builder
  • Online Report Generator
  • Redshift Data Visualization
Dashboards
  • Dashboard Builder
  • Dashboard Reporting Software
  • Dashboard Creator
  • KPI Dashboard Software
Quicklinks
  • Contact Us
  • Docs
  • Jobs
  • BI Blog
  • Database Blog
  • Tech Blog
Resources
  • Security
  • Privacy
  • T&C
  • Sitemap
dazzling Theme by Colorlib Powered by WordPress