Key Features
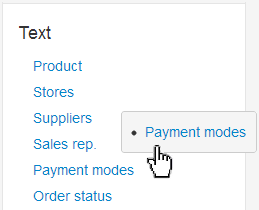
Create dashboards & charts using drag & drop
Play with any kind of data (e.g user activity, sales, logistics, marketing, etc) in your database using drag and drop reporting.
Interactive charts & visualizations
See data in different ways with 24 types of visualizations.
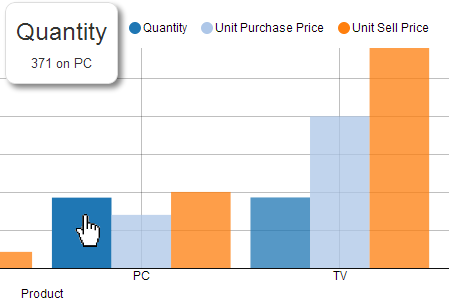
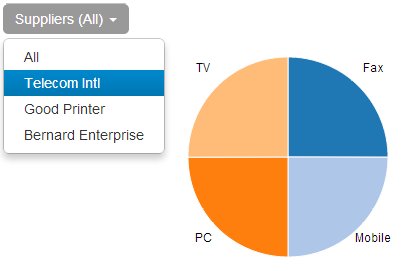
Powerful Dashboard Filters
Use sliders & drop down dynamic filters to filter all charts on a dashboard, in realtime.
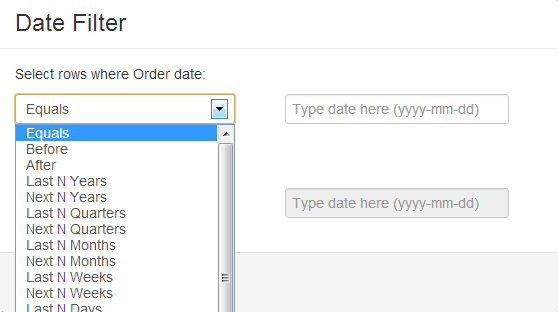
Easily refine your analysis
Powerful filtering functions to define data that goes into each analysis.Perform absolute or pattern matches, comparisons or apply date based filters such as number of years, quarters, months, etc to precisely target the data period you need to look at.
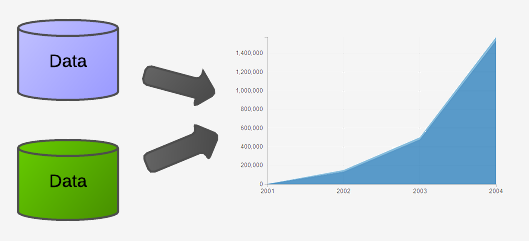
Analyze multiple tables at the same time
Analyze data that spans multiple tables. Ubiq has the ability to pull data from different tables into each view.
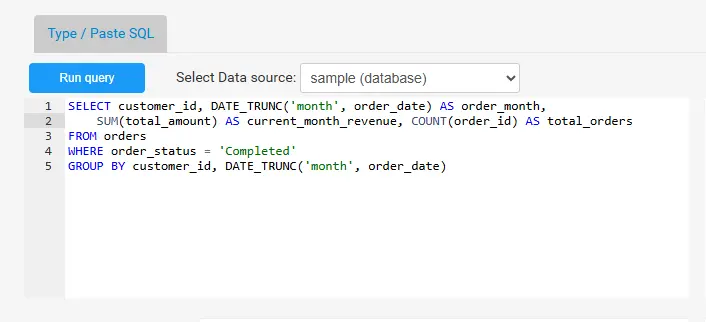
Create Custom SQL queries
Ubiq also provides an SQL query editor that allows users to write custom SQL queries and visualize results in multiple ways. It supports complex joins, nested queries, aggregations and even formulae.
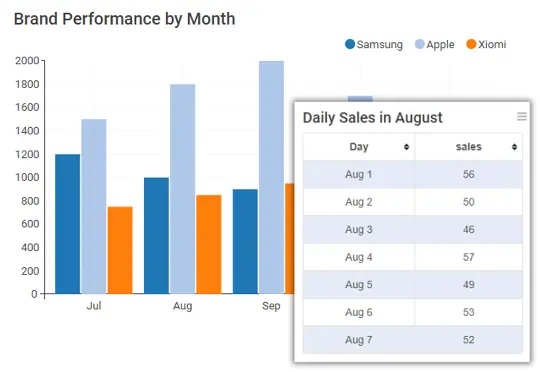
Drill Down Reports
Our drill down reports make it easy to analyze, investigate and go deeper into charts and reports to get insights, and answer questions
Schedule Email Reports
Scheduled reports to automatically receive email reports daily, weekly or month at a time of your convenience.

Custom Formulas
Create Custom Formulas from database table fields and columns and use them directly in your SQL query and reports. Great for complex calculations. No need to type or mention the entire formula everywhere.
Dashboard Themes
Style your dashboards with our palette of themes!
Powerful User & Access Management
You have complete control over who can access your dashboards. Add team mates as creator or viewers for each project.
Collaborate with your team
Export your dashboards & charts as PDF or Image (PNG). Also export chart data as CSV.
Multiple Data Sources
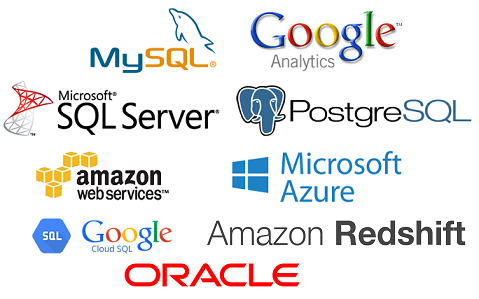
Ubiq supports multi-database reporting. It currently supports MySQL, PostgreSQL & SQL Server databases. You can also connect your AWS, Azure, Redshift data sources. More to follow soon!

Secure to use
Securely setup ubiq for publicly accessible computers or cloud servers. If you set it up for intranet or private network, our unique architecture ensures the data doesn't leave your network. Ubiq connects to your databases with read only access. Assign create or view permissions to your team mates.