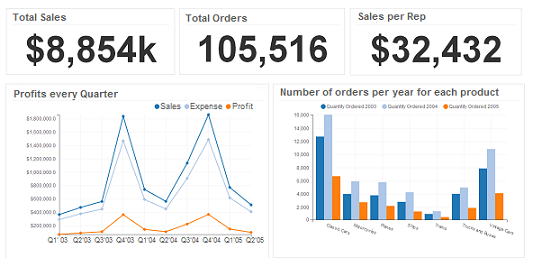
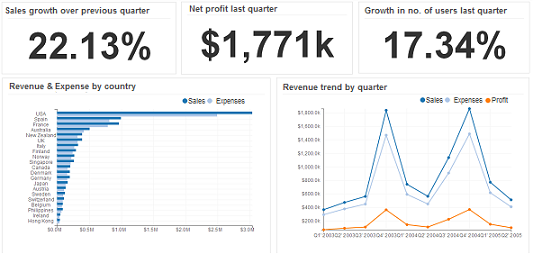
Business Analytics Software and Reporting Solution that lets anyone run business analytics, create interactive dashboards and reports in minutes. Quickly transform raw data into meaningful business insights. Easily analyze your business data, monitor it using business dashboards, visualize information for all areas of your business. Ubiq enables our customers to measure what matters the most, discover growth opportunities, spot risks, and gain insights that drive the right actions. It provides everything you need to gain valuable insights from all your data. Easily anticipate opportunity, take action and have an impact. Ubiq offers the widest range of advanced analytics, enabling fact-based insights. Get the right information to the right people at the right time.
See how easy it is
Ubiq Business Analytics Tools enable even non-technical users to analyze data and build interactive dashboards and business intelligence reports. Ubiq provides a wide range of dashboard widgets to use the best visualization for your data: geographical maps, gauges to measure KPIs, line charts to determine trends, scatter plots to see correlations, and pie charts for clear comparisons. Customize your dashboards using our drag and drop interface. Easily place dashboard widgets precisely where you want. You can effortlessly add/remove visualizations and filters on a dashboard. Ubiq reporting tools enable you to customize report layouts and dig deeper into trends & numbers without any programming.
Using rich data visualizations enable you to see the best insights quickly. Ubiq Business Analytics Software provides an exhaustive portfolio of visualizations. Our interactive, web-based dashboards ensure that your grasp information in the most meaningful manner. Advanced capabilities such as filters and drill-downs let you use a variety of data visualization tools. Use drag-and-drop to explore data at the speed of thought, or use global filters to instantly update widgets across your dashboard, with just a click. Our dynamic visuals and interactive BI reporting allows you to change a chart by simply clicking on it. You can drill down into each visual you build, to get underlying report and understand the big picture. Choose from a wide range of reporting components - graphs, charts and visualizations - to create insightful dashboards. In addition to the basic chart types, ubiq provides many advanced charting options such as pivot tables, crosstabs, combination charts and even maps.
Ubiq business analytics software empowers even non-technical users to analyze 100 times more data at 10 times the speed of other solutions, all while supporting thousands of queries. This enables people to ask more questions and discover more valuable information, which can be used to drive business performance and grow your business faster. You can have terabytes of data, such as tons of historical data, where everyone can run queries and get business answers in just seconds. Analyze, visualize & report data located anywhere directly from your data, directly from your browser. Seamless business analysis & reporting for your team, clients & partners.
Perform business analysis & reporting in real-time. Ubiq dashboard software allows you to run business analytics in real-time. You can refresh dashboards as often as you like, or set it to automatically refresh at regular intervals. Track key metrics, trends and numbers about your business in real time reports & dashboards. Dashboards & reports always show the latest up-to-date information. No need to manually change or update anything when you need to use additional or real-time data. Auto refresh feature automatically updates dashboards with latest data. We ensure you get the latest insights as fast and easily as looking at your watch. You can monitor your dashboards with live data, or schedule automated reports. This not only makes reporting easier, but also enables everyone in your organization to directly access their dashboards independently. Admins can easily permissions to deny or allow access and functionality to specific users. Stay up-to-date on new business insights, all the time.
Preparing data for business analytics is the biggest nightmare faced by organizations. With so many different data sources, it can be extremely tedious and time consuming. Ubiq Business Analytics Tool enables even non-technical users to analyze data from multiple source and view insights on a single dashboard or report. No coding or expensive hardware, and little to no help from IT. Create, view & share business analysis & reporting on all platforms. Do away with the work of standardizing data for business analytics, and go straight to visualization and insights. Use our built-in connectors to join multiple data sources and formats. While other business analytics tools require an IT team to prepare data by coding, Ubiq is the only business intelligence tool in the market that allows business users to drag-and-drop data to analyze them.
Easily collaborate on the same report, and share the same insight. This ensure everyone is on the same page and looking at the same numbers. Since Ubiq dashboards are web-based, everyone can access, view, and interact with the same report, without downloading any files. Share dashboards with a URL, and invite others with just a click. Shared dashboards are completely interactive so even others have the ability to refine, filter, drill down or make a copy of a dashboard to investigate even further.
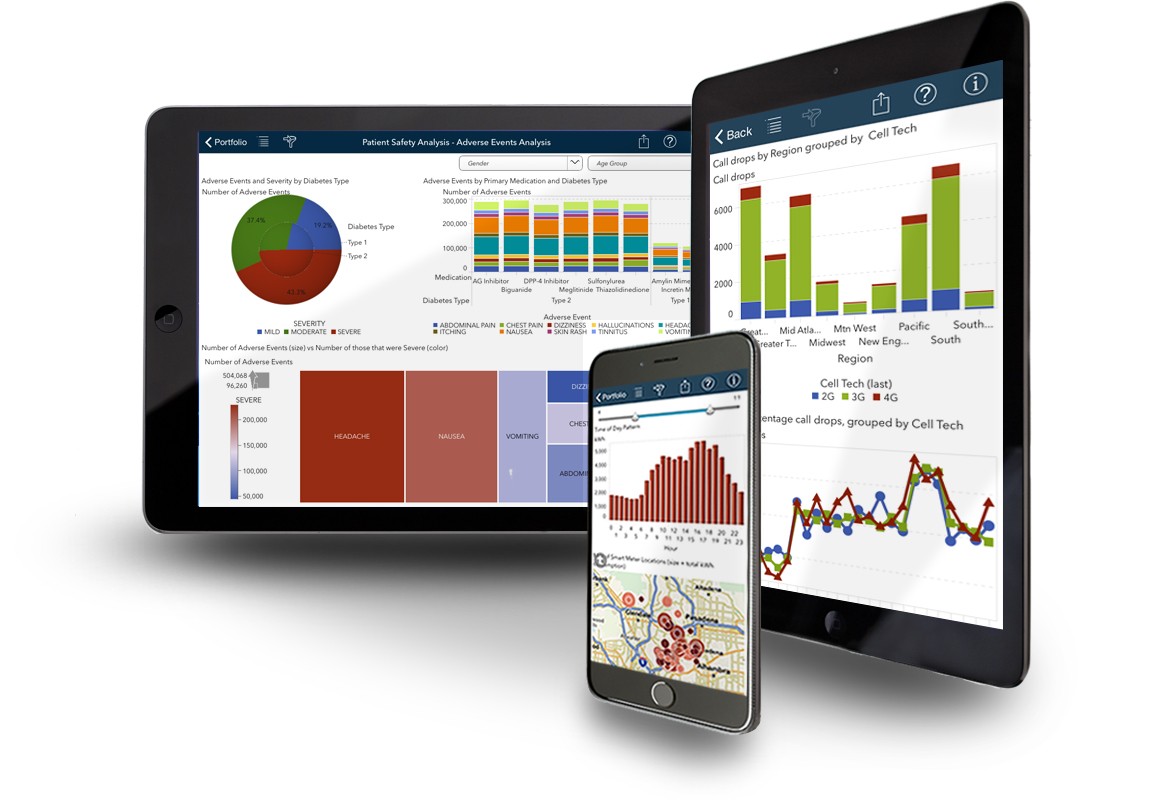
Access business analytics on-the-go, on any device. Seamlessly interact with dashboards using any device, including desktops, mobiles, and tablets. View a dashboard on the fly, filter to see detailed insights, and receive up-to-date data in seconds. Ubiq is the only business analytics tool that can keep up with thousands of users who need information and insights right from their mobile. With mobile, cloud-based Business Analytics Solution, gain 24/7 real-time access to your critical data. Get the information you need - the moment you need it - with our mobile BI analytics solutions. This increases collaboration and enables informed decision making. By giving business users access to real-time information, you empower them with much more insights and the ability to make informed action no matter where they are. It boosts your organization's responsiveness and productivity.
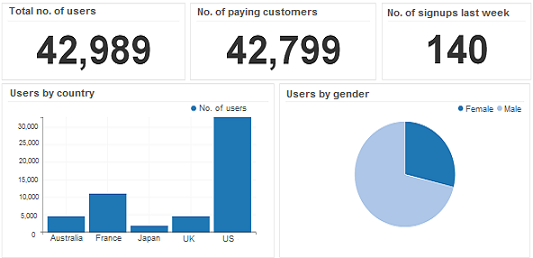
Business Analytics Software enables organizations to analyze business data, create interactive dashboards to visualize data and gain insights, make informed decisions and take action. Business Analysis allows you to quickly spot opportunities and risks, and respond quickly. Easily run business analysis on your data, create analytics dashboards and reports to share insights with everyone. Ubiq ensures you get the best insights by combining all your data sources, providing advanced analytics capabilities to unlock insights, present it using an exhaustive portfolio of data visualizations, collaborate and share it with others. Try Ubiq to harvest high-quality trends from your data, and arm decision-makers with the most accurate information.
Some of our valuable customers across various countries