Business Intelligence Dashboard Software for you Business


  • ✓ Build BI dashboards faster

  • ✓ Fully Customizable Dashboards

  • ✓ Access dashboards on the go

  • ✓ Get powerful business insights

  • ✓ Easy to use. Save time & money


Try ubiq for free!


Why use Business Intelligence Dashboard Software?

BI Dashboard Software lets you create interactive dashboards, in minutes. Transform data into insightful dashboards and charts for your organization. We offer easy-to-use, dynamic dashboard software that enables you to create business dashboards to get at-a-glance information across your business. Build interactive, fully customizable dashboards without coding. Beautiful dashboards present data in an easy-to-understand format. Share reports & dashboards with your team in a variety of formats. Get a quick view of your key performance indicators & business metrics. Ubiq's interactive dashboards make reporting and data visualization simple.


Try it for free!


See how easy it is


create business intelligence dashboard using drag and drop interface

Create dashboards in minutes

Ubiq is an easy-to-use business intelligence dashboard software that enables you create and share interactive dashboards for your business. Quickly transform data into dashboards & charts. Its user-friendly interface enables your team to build dashboards quickly and find out data relations sooner. It provides a robust, cost-efficient capability that quickly pays significant dividends. It's a new kind of BI dashboard software. Whether you are new to business dashboards or a professional, Ubiq has you covered. Create online dashboard using drag & drop interface. Place and move charts and graphs with ease. Click, drag. Done.


Customize dashboards fully with a few clicks

Create fully customizable dashboards that suite every area of your business. You select the charts, the colors and the design. Choose the graphs, charts, infographics and maps you want. You're in total control. Easily customize the dashboard look and feel, color theme, and layout to highlight insights. Every business has various kinds of users who need different type of dashboards. Ubiq provides tons of customization features and rich formatting options to create dashboards for every user - from Executives to Data Analysts - in your organization. Customize your dashboards to deliver better insights, faster. Get more value from data instantly.


bi dashboard software to easily customize bi dashboards


create insightful business intelligence dashboard

Get powerful insights. Uncover hidden correlations

Business Dashboards help you discover powerful insights and hidden correlations within your data. Start saving money for your business and impact your bottom line today. Use our business dashboard tools to get in-depth, actionable insights from across varied business data. Ubiq is a business intelligence service that helps you to easily create insightful reports & dashboards for informed decision-making. No matter who you are, or which industry you work in, Ubiq can rapidly reduce the time it takes to build beautiful dashboards and discover powerful insights. Ubiq Business Dashboard tools (BI Dashboard tools) enable companies to generate business insights to make smarter, better decisions that drive results.


Go beyond basic charts & graphs

Create dashboards with advanced charts & graphics. Visualize data in sophisticated ways to clearly communicate your insights. Ubiq offers a whole new portfolio of interactive graphics, maps, charts & visualizations. Choose from a wide range of reporting components. Use a variety of graphs, charts and visualizations to create insightful dashboards. Blend data from multiple sources in a single dashboard. With advanced filtering and search capabilities, you can easily view your data in greater detail. In addition to the basic chart types, ubiq provides many advanced charting options such as pivot tables, crosstabs, combination charts and even maps. Auto charting eliminates the need for coding and IT support.


interactive business intelligence dashboards and charts


easy to use bi dashboard software tools

Simplify Business Intelligence for your organization

Ubiq is the only business intelligence software that lets you easily analyze both big and diverse datasets. Analyze complex data with complete agility. From beautiful dashboards to interactive analytics, Ubiq provides a simple way to manage, analyze and visualize all your data. Deliver exceptional business intelligence at a fraction of time & cost it takes with other vendors. Designed for users who need to analyze & understand data but have little or no prior experience with business intelligence and dashboards. Ubiq takes you from data visualization to dashboards with a single BI solution, without the need to use additional tools. Quickly setup business intelligence tools without depending on IT.


Access Business Intelligence Dashboards from anywhere

Access business intelligence dashboards & reports on any platform - laptop, tablets or mobile. Ubiq automatically adapts to desktop, tablet and mobile phones. Take your business dashboards with you everywhere. Ubiq enables you to access your dashboards from any device, anywhere, anytime. This enables everyone in your team access dashboards wherever they are, whenever they want. Managers and Executives can view dashboards on mobile while Data Analysts & Marketers can view it on their workstation. Get the right information to the right people at the right time. An easy-to-use dashboard software that anyone can use. Save weeks & months otherwise wasted in setting up a BI Solution for your organization.


mobile bi dashboard software tools. responsive interface


Try it for free!


Benefits of BI Dashboard Tools

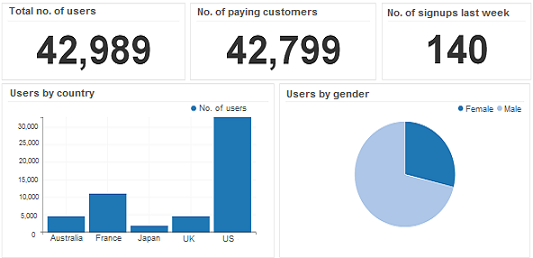
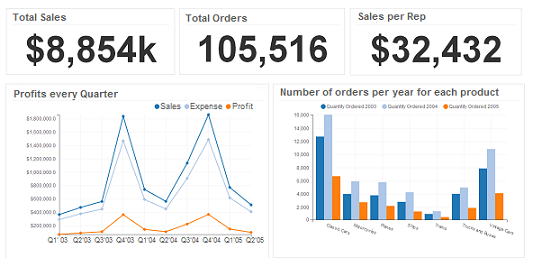
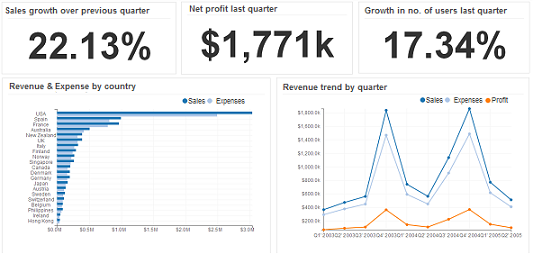
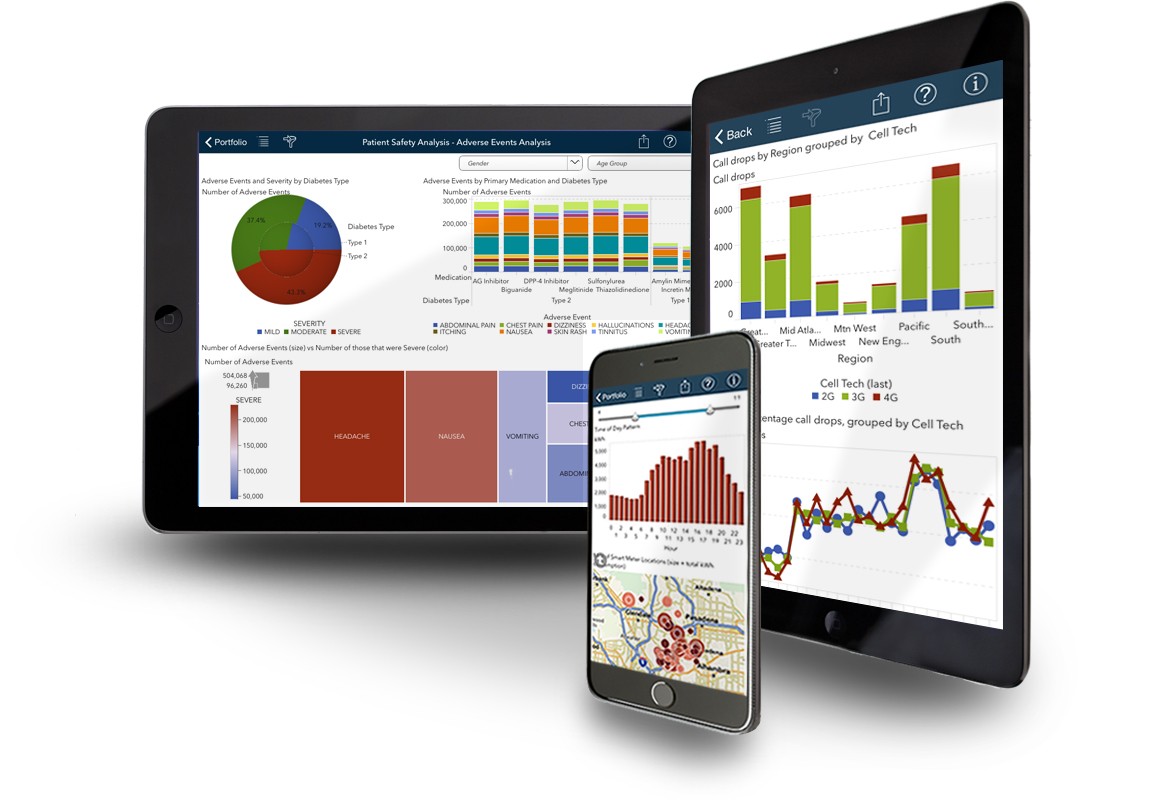
Business Intelligence Dashboard Tools provide a web-based platform that enables development of custom, interactive dashboards for your business. It acts as a central BI Dashboard Tool for your business, where users can visualize, explore and analyze data from across the organization. With the suite of analytical tools that Ubiq offers, you'll be able to create dashboards in a jiffy and receive up-to-date information about all areas of your business. Our dashboard software lets users create their own reports on-the-fly using a drag and drop interface. Ubiq comes with more than 30 powerful data visualizations including interactive charts, gauges, maps, and more. This allows you to always use the right data visualization for the information you want to display, and highlight insights with your dashboard designs. By connecting directly to your live data sources, your dashboards always show the latest data and can be automatically refreshed. Our dashboard software enables users to quickly access information they need without depending on IT to generate a report. Drag and drop columns to easily create your own dashboard, and save it for future reference. You can also share your dashboard with others and export the results to Excel for further analysis. Ubiq is one of the most powerful, flexible dashboard software available.


Some of our valuable customers across various countries