Connect Your Database
Configure a supported Amazon Aurora connection using the appropriate database credentials and access settings.
Amazon Aurora Reporting
Turn data stored in Amazon Aurora into useful reports and dashboards. Explore your data with visual reporting tools or SQL, then filter, schedule and share insights with your team.

From database to decisions
Operational and application data is valuable when teams can explore it without repeatedly building reports from scratch. Ubiq helps turn database records into understandable reports, charts and dashboards.
Use reporting software to organize results, dashboard software to monitor metrics, and analytics software to explore patterns across your data.
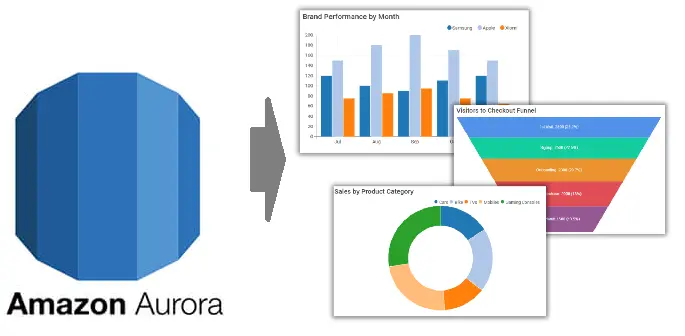
Reporting workflow
Configure a supported Amazon Aurora connection using the appropriate database credentials and access settings.
Choose data and build reports using the visual report builder or SQL query editor.
Present results in dashboards, apply filters, and share useful reports with the right colleagues.
Different teams prefer different ways to work with data. Build reports visually when you want to move quickly, or write SQL when you need more control over your queries.
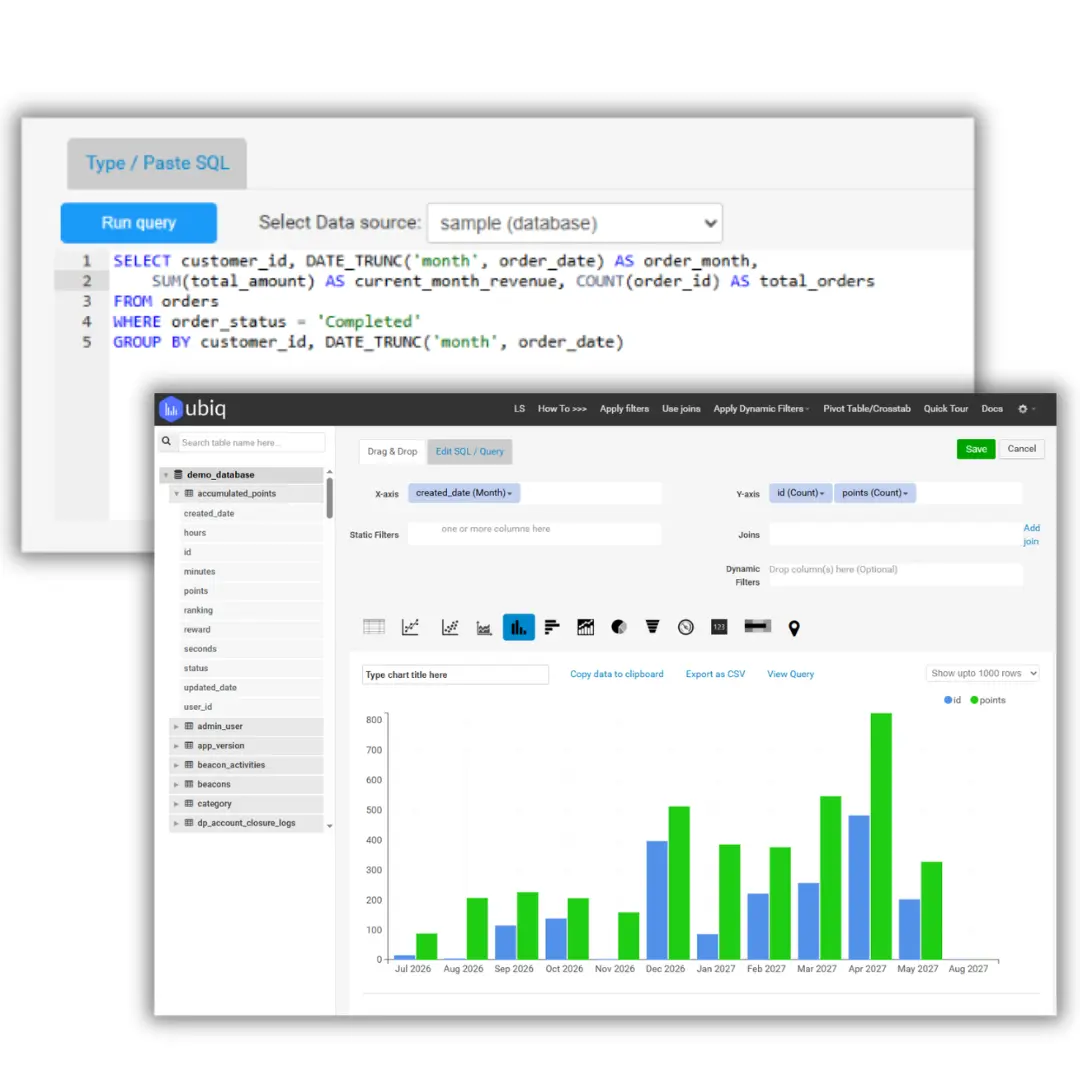
Move from summary metrics into underlying records with drill-down reporting.
Focus on relevant time periods, segments and values using dynamic report filters.
Automate recurring updates with scheduled reports.
Distribute insights responsibly with report sharing and permissions.
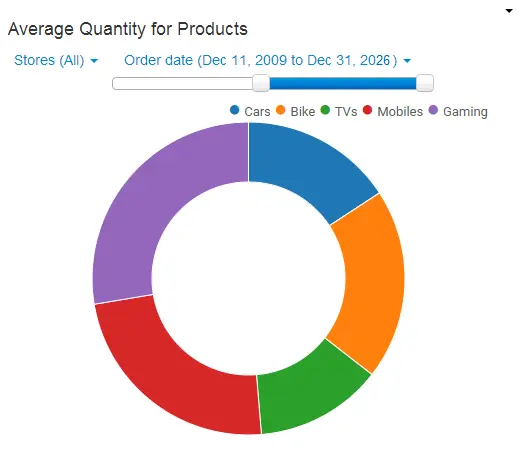
Combine metrics into dashboards that help teams review activity, identify changes and understand performance. Explore data visualization to present information in accessible charts and tables.
Use cases may include application activity, sales operations, inventory monitoring and internal performance reporting, depending on the data stored in your Aurora database.
Amazon Aurora can be one part of a broader reporting environment. Ubiq also offers reporting workflows for other database platforms, helping teams work with data from different systems.
Explore reporting for databases hosted on Amazon RDS.
Explore Amazon RDS reportingCreate reports and dashboards using data from MySQL.
Explore MySQL reportingAnalyze PostgreSQL data with reports and dashboards.
Explore PostgreSQL reportingTurn SQL Server data into business reports.
Explore SQL Server reportingBuild reports and visualizations using MariaDB data.
Explore MariaDB reportingLearn how Ubiq supports reporting workflows across database connections.
Explore multi-database reportingExplore these related resources and replace the tutorial placeholders below with verified live tutorial URLs when available.
Understand how database reporting fits into your analytics workflow.
Explore database reportingLearn about building reports without writing every query manually.
Explore visual reportingSee how SQL can help shape database reports.
Explore SQL reportingCreate dashboards, explore metrics and share insights with your team using Ubiq.
Get Started with Ubiq