How to Build Metrics? How many metrics does a dashboard have? If you have these questions about defining business dashboard metrics, we might be able to help you. If you don’t display the right metrics on your business dashboard, it will confuse and even misguide your audience. Here’s how to build metrics for business dashboard reporting.
How to Build Metrics for Business Dashboard Reporting
Here are the tips to help you build metrics for business dashboard reporting.
1. Keep your metrics relevant to the audience
Your business dashboard metrics must be important to your target audience. Otherwise, it won’t be useful to them. When you define business dashboard metrics, gather business intelligence requirements first. Ask yourself the following questions:
- Who is your target audience?
- Is this metric important to them?
- At how much detail should you report this metric?
Different people have different requirements. For example, daily sales numbers might be useful for a sales manage but a CEO will be interested in monthly/quarterly numbers. So make sure you include the right metrics in your dashboard, and report them at the appropriate level of detail. Don’t keep more than 12-15 metrics on a business dashboard.
2. Metrics must be actionable
Business dashboards are meant to evoke decision-making and subsequent actions. So your metrics must be actionable, that is, they should be numbers that can be improved through repeatable tasks and specific goals. At the end of the day, business dashboards help you track performance against specific goals. So include metrics that can be improved.
3. Metrics should update frequently
Today, most BI Reporting tools allow you to automatically refresh business dashboards every minute, with the latest information. In fact, if possible, metrics should display real-time information. This will keep your audience up-to-date, even while on the move. Determine how often your audience needs information and update dashboards accordingly.
4. Provide the right context
Just as images & texts, even graphs & charts need the right context to be effective. You can do this in multiple ways. First of all, provide relevant report title for each metric. This will help your audience understand what they are looking at. Secondly, use visual cues such as contrasting colors, highlighting, etc to underline your point. Third, display a high-level metric on your dashboard, and also provide 1-2 supporting metrics below it, with more detailed information. It will make the metric more actionable. Reporting tools offer all these features out-of-the-box.
5. Use the right visualization
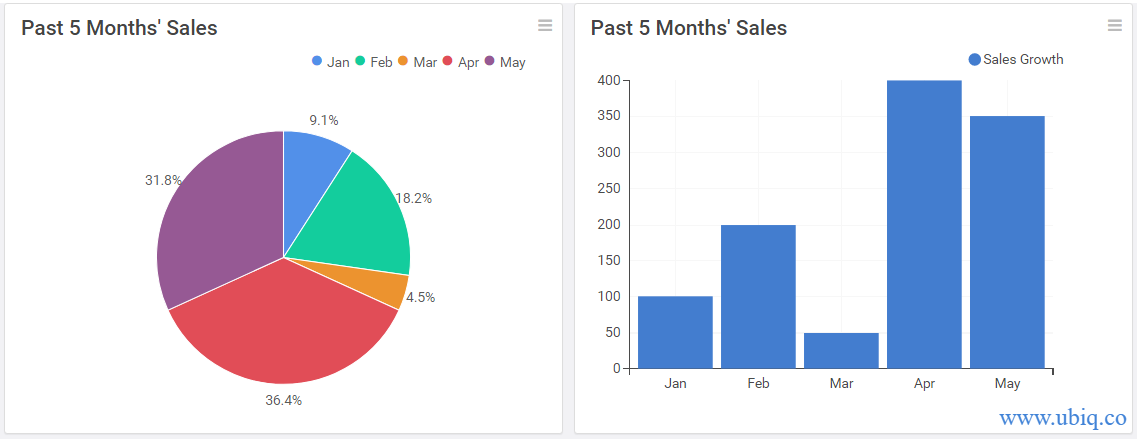
When you build metrics for business dashboard, make sure you use the right chart type to visualize your metric. If you use the wrong visualization, it will confuse the viewer. Here’s an example. Which of the following visualizations is easier to understand?

The sales trend is obvious in the column graph on the right, while you end up wasting time between the chart and its legend, in case of the pie chart. Similarly, make sure you pick the right type of business dashboard to plot your metrics.
6. Use colors sparingly
Dashboards are highly visual elements and can be distracting if you use too many colors. People often crowd their dashboards with too many visualizations, each having different colors. So the user ends up wasting time trying to make sense out of all those colors, and also ends up missing obvious data trends. So, use a few colors and group related metrics together.
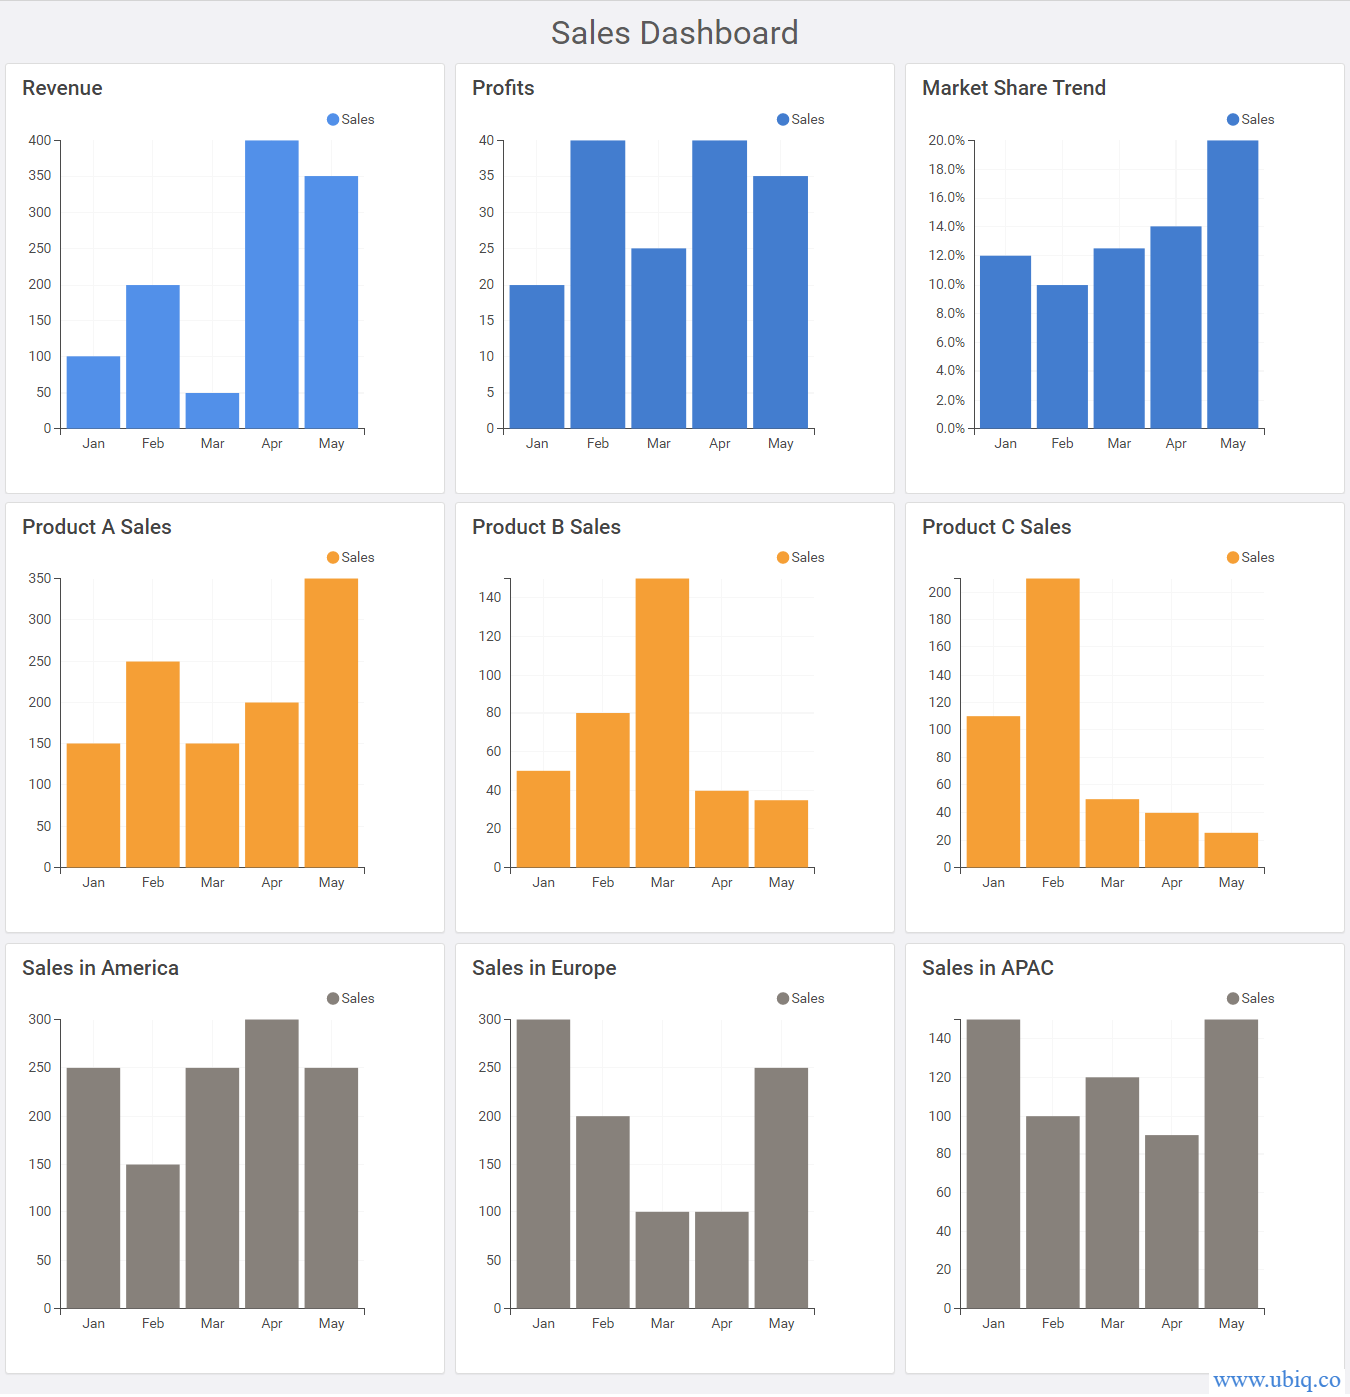
When you build metrics for business dashboard, their placement and colors play an important role. Here’s an example of sales dashboard built using Ubiq

The placement of metrics above, combined with similar colors, make it easy to analyze trends, make comparisons and get insights.
Hopefully the above tips will help you build metrics for business dashboard, help your audience get insights quickly and make better decisions. If you want to create business dashboards, reports & charts, you can try Ubiq. We offer a 14-day free trial!
Sreeram Sreenivasan is the Founder of Ubiq. He has helped many Fortune 500 companies in the areas of BI & software development.