BI Reporting Software for your business


  • ✓ Create interactive dashboards & reports in minutes

  • ✓ Combine data from multiple sources

  • ✓ Share & Collaborate on BI Reports

  • ✓ Easy to use BI Reporting Tool

  • ✓ Powerful features, yet Affordable


Try ubiq for free!


Why use Business Intelligence Reporting Tool?

BI Reporting Tools like Ubiq enable anyone create interactive dashboards & reports in minutes. Ubiq is a self-service analytics and BI reporting tool for your business. Easily retrieve, analyze, transform and report data, and make better decisions. Combine data from multiple sources in a single report. Create interactive reports and dashboards using a variety of visualizations. Perform meaningful analysis on your data. Collaborate and share BI Reports with your team. Easily assess business processes, performance, market trends and other factors to grow faster.


Try it for free!


See how easy it is


reporting, business intelligence software

A Complete Reporting, Analytics & Business Intelligence Tool

Use a fully function BI Reporting tool that provides all the features required to create reports easily & quickly, with minimal IT involvement. Ubiq is a self-service analytics and BI reporting tool that lets anyone create interactive dashboards & reports in minutes. Even business users can easily create reports using our intuitive drag-and-drop interface, with no coding or assistance from IT. Ubiq provides wide range of tables, charts, graphs and other visual BI tools that can be used to generate interactive data visualizations. Build interactive reports that can be quickly shared using web browser. Easily unify disparate data sources. Combine data from multiple data sources in a single report. Enable centralized data management for your organization. Being web-based, Ubiq maintains a single version of business data and ensures every person in your team sees the same numbers. Benefit from automatic or manual data refreshes. Reports can be automatically refreshed at regular intervals.


Combine data from multiple sources into single BI Report

Ubiq Business Intelligence Software provides an easy-to-use drag and drop interface that enables even non-technical users to combine their data sources in one place, and build insightful reports with beautiful visualizations. No coding or expensive hardware, and hardly any help is required from IT. Ubiq provides in-built connectors to pull data from multiple sources, including cloud or in-house business applications, with just one click. All reports and dashboards use real-time data. Auto-refresh feature automatically updates BI Analysis and dashboards with the latest information. This helps everyone in your organization to analyze the same numbers, be on the same page and get the latest insights. Ubiq brings easy-to-use, real-time Business Intelligence tools directly to your browser.


business intelligence across data sources


analytics, business intelligence tool

Analyze large volumes of data in seconds

Ubiq Business Intelligence Tools easily support terabytes of data and thousands of users out-of-box. Without the limitations of size and speed imposed by other BI Reporting tools, Ubiq enables you to easily query and create reports blazingly fast. Ubiq Business Intelligence Software enables you to rapidly analyze and visualize data to make better decisions, faster. End users can analyze data with extremely fast querying and calculation speeds, using a style of analysis known as "slicing and dicing." Explore data in seconds and gain meaningful insights.


Build BI Reports with variety of beautiful visualization

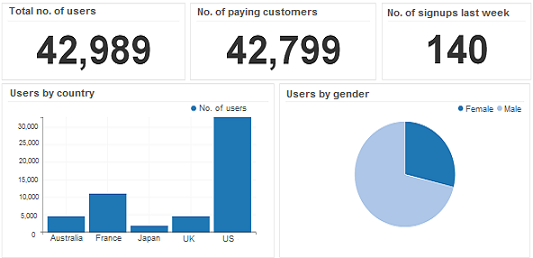
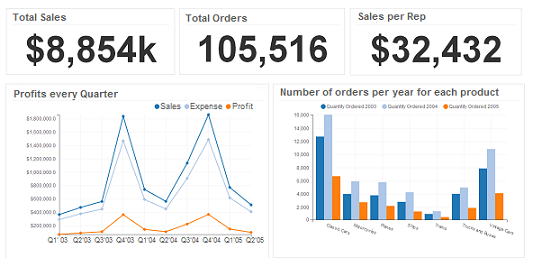
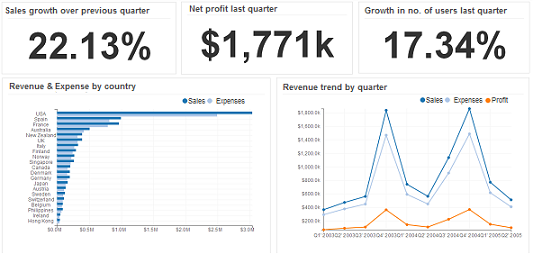
Ubiq BI Tool provides a wide range of HTML5 data visualizations to visualize data, discover trends, make comparisons and track KPIs. Choose from a variety of reporting components to create insightful reports and dashboards. Ubiq provides an exhaustive portfolio of visualizations to create every type of report: charts, maps, gauges, line charts to determine trends, pie charts for clearest comparisons and scatter plots to spot correlations. In addition to the basic charts, ubiq also provides many advanced visualization options such as pivot tables, crosstabs and combination charts. Auto charting eliminates the need for coding and IT support. Drill down, search, filter and perform quick data analysis across entire report with just a click. Create BI Reports and interactive dashboards for every area of your business


interactive bi reporting and dashboards


collaborative business intelligence. share bi reports & dashboards on mobile & tablets

Share reports on mobile, tablets & PC

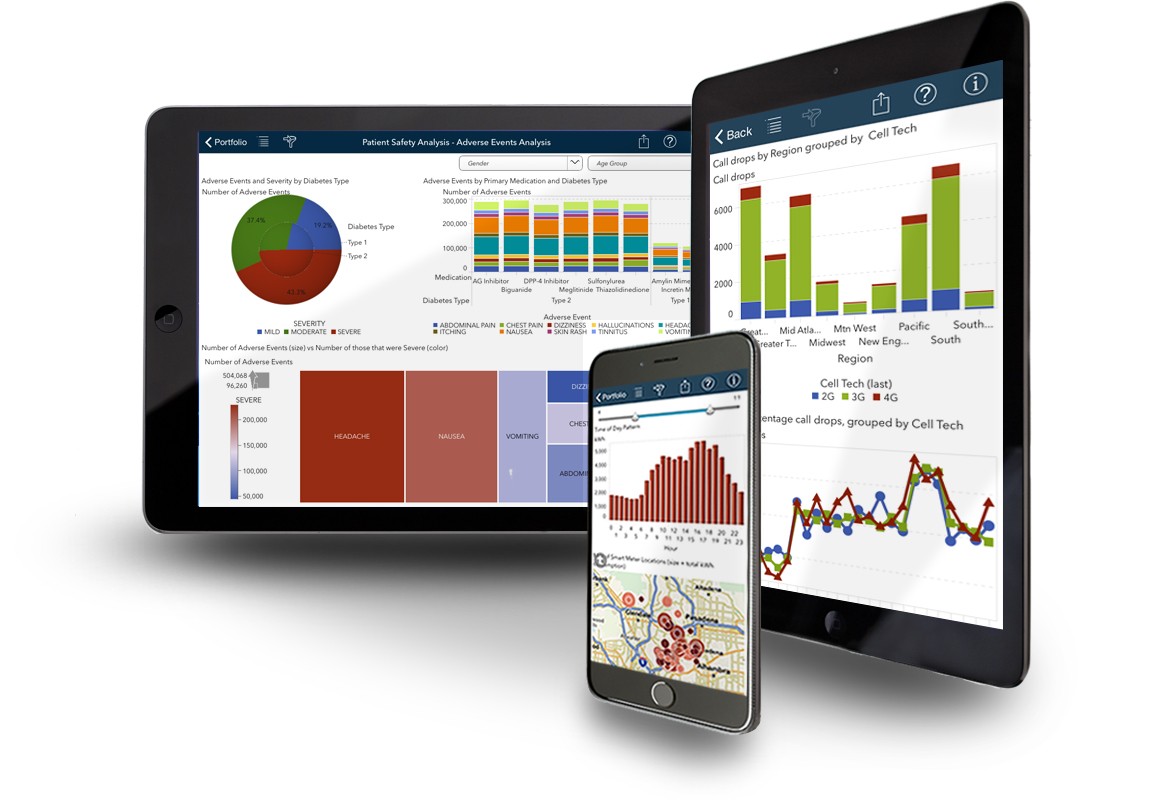
Ubiq BI Reporting Tool enables you to create web-based reports and dashboards. This means you can easily develop reports with your colleagues for better, collaborative decision-making and analysis. Empower your entire team to create, access, monitor and interact with dashboards in real-time or create a personal copy for themselves, simply using web browser. View a BI dashboard on-the-go and get up-to-date insights from your data with BI Reporting tool that runs on any device. Access BI reports & dashboards on any platform - laptop, tablets or mobile. Create and share BI Reports directly using web-browser.


Try it for free!


Benefits of BI Reporting Software

Ubiq business intelligence software makes it insanely easy for users to create interactive reports and dashboards in minutes. Easily prepare, analyze, visualize, and report complex data. Ubiq provides an end-to-end BI solution to handle growing data sets from multiple sources and out-of-the-box ability to analyze terabytes of data and support thousands of users. Ubiq BI Reporting Software is so easy to use and intuitive that it can be used by every member of your organization. It is a self-service analytics and BI reporting tool designed for use by executives, business managers, marketers, data analysts and finance - not just IT. It provides seamless capability to drill down, search, filter multi-dimensional data. Ubiq Business Intelligence Tool fills the gap between legacy, bulky tools that are expensive and tedious, and more modern visualization tools that, although business friendly, lack the powerful features to handle a variety of data sets. With Ubiq BI Reporting Tools, even business users and non-technical users can build reports and dashboards, join data sources, and get insights completely on their own.
Some of our valuable customers across various countries