Did you know there are different types of business dashboards? Dashboards make it easy to get at-a-glance status of your business and take decisions. However, if you don’t use the right type of business intelligence dashboard, then you might confuse your audience. Let’s take a look at the different types of business dashboards that exist and when to use them.
Types of Business Dashboards You Must Know
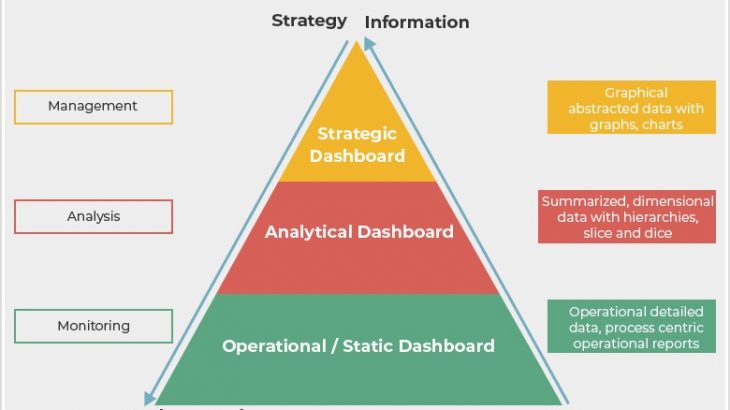
There are main 3 types of business dashboards that you can use as reference when you build metrics for business dashboard reporting.
Strategic Dashboards
Strategic dashboards are high-level business dashboards that help senior management track the performance of their company or business areas against their business goals. It should contain high-level KPIs that help your target audience if their strategy is working or not. Avoid going into too many details, and nitty-gritties, while designing a strategic dashboard. Basically, a strategic dashboard helps you monitor the performance of your business strategies.
Target Audience
Strategic dashboards are meant for top-level executives such as CEOs, CFOs, CXOs, etc as well as senior management VPs, or even business heads.
Benefits
Strategic dashboards help the audience quickly get a high level view of their business strategy, track performance against goals, identify areas of improvement and discover growth areas. E.g how did the new marketing campaign perform?
When to Use
You must strategic dashboards when you are presenting to the senior management of your company. In case they ask for details, you can supplement a strategic dashboard with other more detailed ones, covered below.
Here’s a sample dashboard built using Ubiq

Here are the Key Financial Charts and Graphs every business must monitor regularly.
Analytical Dashboards
Analytical Dashboards are data-heavy types of business dashboards that allow users to investigate business questions and get answers. So it contains trends, comparisons, distributions & predictions, with the ability to filter and drill-down into data. It must not only contain present but also historical data. Most dashboard software support filters & drill-downs. Analytical dashboards are generally prepared by business analysts/data analysts for middle-managers, who want them to find answers to specific business questions. Analytical dashboards can also supplement a strategic dashboard during meetings & presentations.
Target Audience
Analytical dashboards are meant for middle and senior managers, as well as executives, who are trying to make sense out of all the generated data. It also helps users investigate into issues and answer business questions. Sometimes, analytical dashboards are also used for discovering new areas of growth, or upcoming trends.
Benefit
Since Analytical dashboards are data-heavy they can be easily used for ad-hoc analysis and data visualization. It’s a great tool to understand vast amounts of data quickly, and get business insights. E.g why did the sales of product A go down last month?
When to use
Analytical dashboards can be used to answer follow up questions raised by the senior management, investigate business issues, or customer complaints. It can also be used to get more insights about business anomalies, and unexpected trends. It’s a great tool to use especially when your business goes down, or it suddenly goes up, to do a root-cause analysis and take action.
Here’s a sample analytical dashboard built using Ubiq

Check out Top Sales Growth KPIs you must track regularly.
Operational Dashboards
Operational Dashboards are one of the most common types of business dashboards. They help you monitor business operations regularly by tracking operational KPIs on a daily/weekly/monthly basis. They also contain daily/weekly/monthly trends of these operational KPIs to help you spot any deviations from the norm. They help you ensure that your business operations are running smoothly. They are one of the most common types of business dashboards. Reporting tools allow you to easily create analytical as well as operational dashboards.
Target Audience
Operational Dashboards are meant for managers and department heads that are responsible for operations in their business area. They are not so useful for top-level managers and executives.
Benefits
Operational dashboards help you keep an eye on the key metrics required to monitor the health of your department, business processes and teams. It helps you quickly discover any issues, raise alerts and respond immediately. It is very useful for managers who need to monitor business performance daily/weekly/monthly. E.g, customer service dashboard.
When to Use
Operational dashboards are best suited for monitoring operational processes and departments. Use it when you need to track a specific set of KPIs regularly. It should have the ability to track KPIs against goals and raise alerts in case of issues. They can have some amount of tactical data for investigation, in case of issues. But mostly they are used to track the same few metrics, every day/week/month.
Here’s an example of operational dashboard build using Ubiq

Check out Top 6 Customer Service KPIs You Must Monitor Regularly
Now that you know the different types of business dashboards that exist, make sure to use the right one depending on your business situation and target audience. In any case, make sure to gather and understand the key business intelligence requirements before you begin.
If you want to create business dashboards, reports & charts, you can try Ubiq. We offer a 14-day free trial!