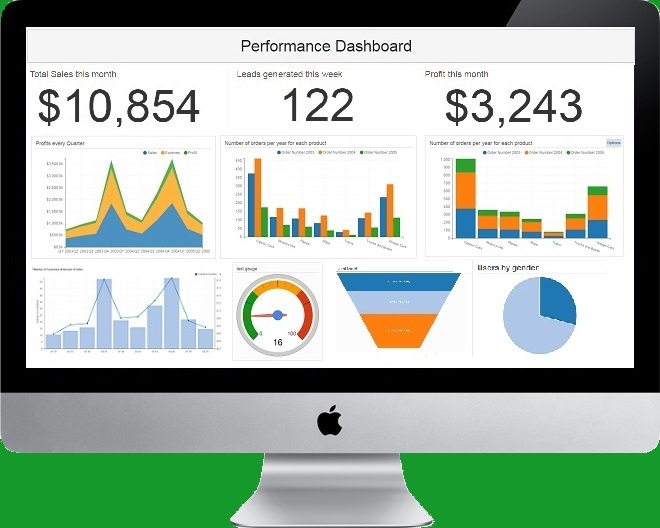
Create rich, professional-looking reports in minutes.

Easy to setup. Build your first report in less than 10 minutes.

Customize every aspect of your report such as layout, chart colors & formatting, with just a few clicks.

Schedule reports to be automatically generated & emailed to your team or clients

Drag & drop data to create insightful reports. No SQL knowledge needed.

Powerful functions to select, sort, filter, group & summarize data. Slice & dice data on the fly.

Export reports in multiple formats such as PDF, PNG, CSV.

Choose from a wide range of advanced visualization options. More than 25 types of visualizations available
Create charts using data from multiple tables. Pull data from different tables into each report. View information from multiple data sources in a single report.
Share reports online with others by sharing URLs.

The most affordable solution. True value for money.

Access reports from PC, tablets & phones. They are responsive and adapt to your device to provide an immersive user experience

Cloud-based Software. Directly from your browser. No need to setup or install anything.

Build complex charts and queries without writing any code. Rich controls enable you to design pixel-perfect reports.
Easily create reports for every aspect of your business. No need to wait for IT. Save days or weeks spent in creating reports.
Ubiq is a Reporting Tool that anyone can use. See for yourself!
