Interactive Data Visualization Tools


  • ✓ Create charts, graphs in minutes

  • ✓ Visualize data using drag & drop

  • ✓ Tons of visualization options

  • ✓ Share charts & reports with others

  • ✓ Supports local, remote or cloud data


Try ubiq for free!


Interactive Visualization Tools for everyone

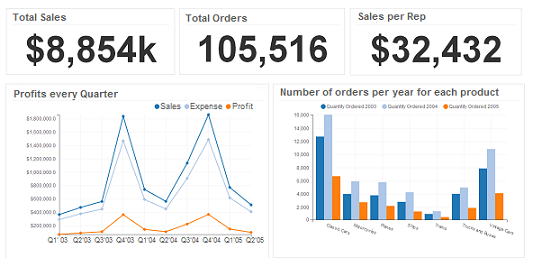
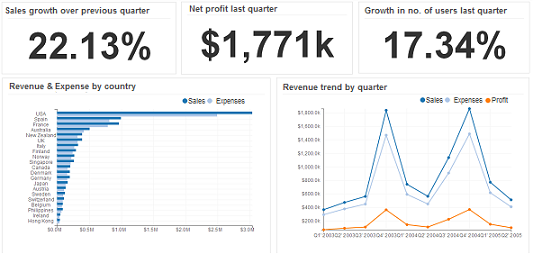
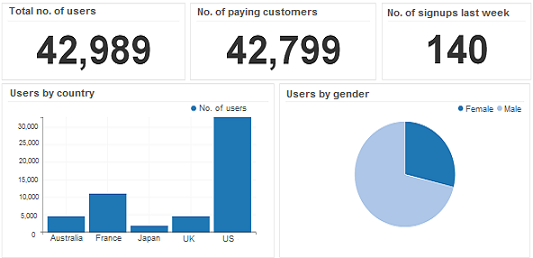
Interactive data visualization tools like Ubiq enable you to visualize raw data into graphs, charts & draw insights. Quickly explore, analyze & visualize data into interactive data visualisations, charts and reports. Share visualizations with others and collaborate.


Try it for free!


See how easy it is


drag and drop

Interactive visualizations in minutes

Visualize data into charts, graphs and tables using drag & drop interface. Easily draw insights and share them with your team. Export charts and share reports with others.


Real-time data visualisation

Data visualisations show live data and update automatically. Draw insights in real-time.


real time


for local or remote MySQL

Cloud-based visualization tool

Visualize data into charts & graphs from multiple data sources, using web browser. Seamlessly gain insights.


Visualize any kind of data

Create charts, graphs & visualizations for your Website or App database, or applications like Magento, Drupal, Wordpress, etc or business areas like Sales, Marketing, Operations, HR, IT, etc.


for any kind of data


cross platform

Mobile-based interactive visualisations

Visualize data anywhere, anytime - on laptop, tablet or mobile. Works with data on Linux, Mac & Windows. A cross platform visualization tool for your data.


Get started in no time

No lengthy installations or reading boring documentations. Sign up & start visualizing data immediately.


get started quickly


secure to use

Secure to use

Securely visualize data and share visualizations.


Try it for free!


Some of our valuable customers across various countries