Data Visualization Application for your Business
-
✓ Create data visualizations in minutes
-
✓ Draw insights. Spot trends
-
✓ Visually analyze data
-
✓ Share visualizations with others
Try ubiq for free!
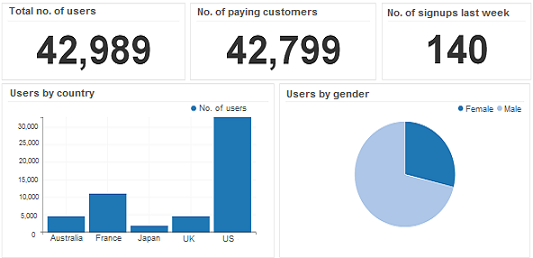
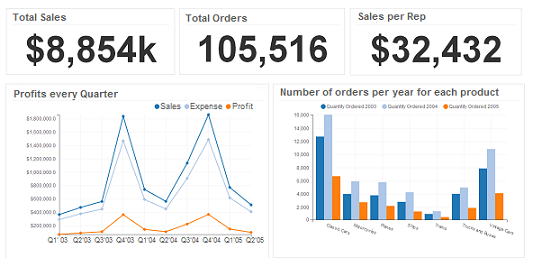
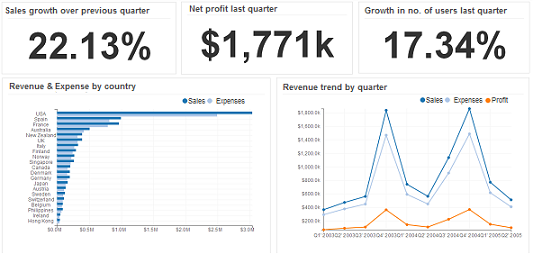

Data Visualization Application lets you quickly create insightful data visualizations, in minutes. It allows users to visualize data using drag & drop, create interactive dashboards and customize them with a few clicks. Data visualization tools allow anyone to organize and present information intuitively. They enables users to share data visualizations with others. People can create interactive data visualizations to understand data, ask business questions and find answers quickly.
See how easy it is

Generally, the people who know the data are unable to use data visualization tools and the people who can use these tools don't know the data. This leads to a huge waste of time with a lot of back-and-forth. Ubiq data visualization tool's intuitive, easy-to-use interface enables anyone to create interactive online data visualizations using drag & drop. By allowing anyone to create data visualizations without needing programming or specialized skills, people can quickly answer their own questions, analyze data faster and easily share insights with others. This ensures that anyone who has data can answer questions on their own. Users can simply drag and drop to create views, add filters and combine views on a dashboard. A few clicks of the mouse can change a filter type, rearrange a dashboard or create a new view.
Avoid wasting time uploading or moving around your data to visualize it. Save days or weeks spent in setting up visualization tools. Connect to your data with just a click and run queries without any coding. Discover insights at the speed of thought. Ubiq is a self-service data visualization tool for everyone. Data visualizations & dashboards show live data and update automatically to show you latest insights. Our breakthrough technology ensures that you get insights within seconds, no matter how big your data. Empower your business to find answers in minutes, not months. Ubiq enables your entire organization to use live interactive dashboards on web browser or mobile device. Comment on dashboards to share insights and findings.

Today's organizations have data spread across various locations, in different formats. Being able to visualize all that data from one place empowers everyone to see the big picture and make better decisions. On the other hand, people need access to business insights and answers, all the time. Being able to visualize data from anywhere enables people to understand data faster, and ask more questions. Seamlessly visualize data from multiple data sources in one place, combine views into dashboards, and share them with others. Create data visualizations simply using a web browser, whether it is on the mobile, tablet or PC. Enable your business to understand all the data from one place.
It can be painful to mail visualizations back and forth. It is error-prone and kills productivity. Ubiq enables you to create data visualizations using web browser. This enables everyone to collaborate and discuss the insights provided by your data. People can easily comment, ask questions and provide feedback. Also, it is tedious to re-create or update the visualization every time your data is updated. Being web-based, these visualizations always show the latest data. Auto-refresh feature ensures that they are automatically updated.

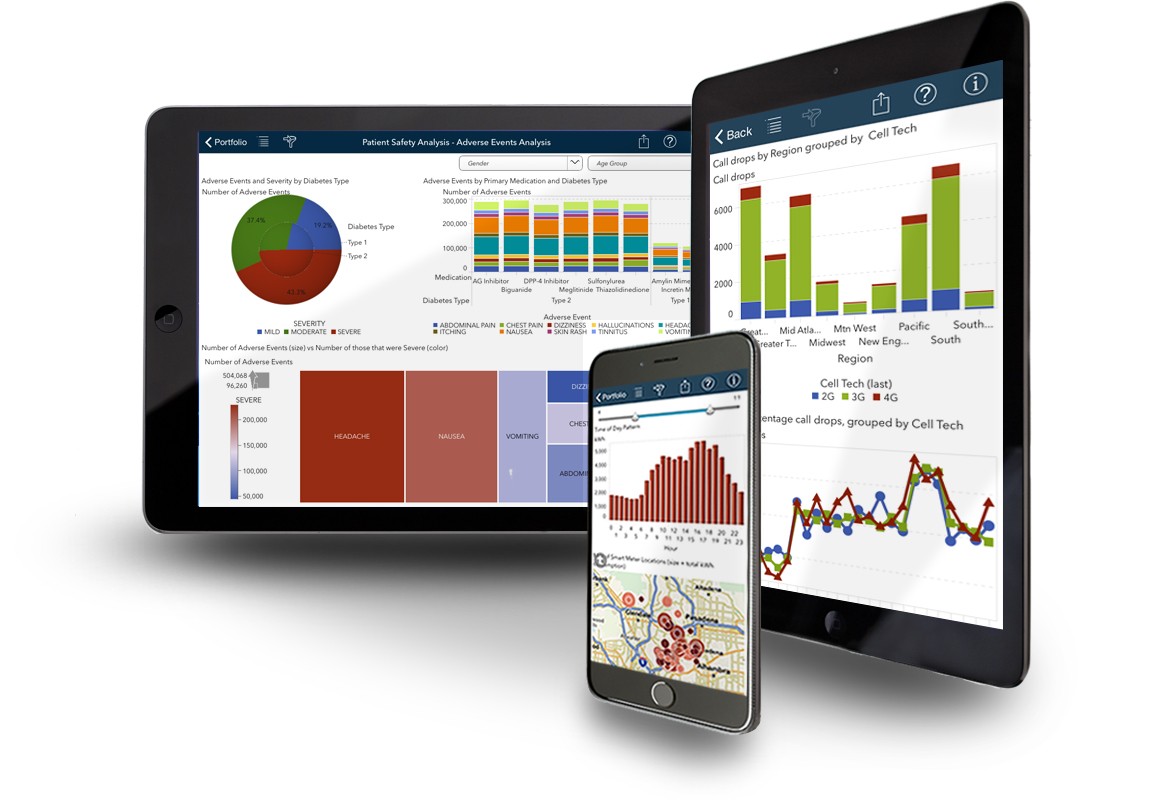
Build a dashboard once, view or edit it anywhere, on any device. All dashboards are fully optimized for mobiles & tablets without any programming. Use familiar tablet gestures to view and interact with dashboards in mobile web browsers. Empower everyone in your organization to access visualizations anytime, anywhere, on any device. Ubiq provides browser & mobile-based insights anyone can use.
Sharing visualizations makes it easy for everyone to understand data and draw insights. It enables people to ask more questions, share insights and get more answers. Share visualizations by simply sharing a URL. You can also publish dashboards in various formats. Or you can schedule automated reports. Ubiq will automatically mail the required visualizations and dashboards to intended recipients. A web based approach makes it convenient to build, change and manage information dashboards for your business.

As data proliferates every area of business, it's becoming necessary to be able to organize it better and understand it quickly. Data Visualization Application enables users to visualize data, draw insights and understand it better. It allows people to organize and present information intuitively. People can understand pictures better than tables that contain rows and columns. By visualizing data, you are able to ask more questions and quickly find answers. You can combine visualizations into a dashboard. Dashboards are useful because they allows you to relate different views of information visually. You may create operational dashboards that are used over and over again, or create dashboards on the fly to dig deeper into an issue. Data Visualization tools provide valuable decision support by allowing users to quickly create and modify dashboards. Being web-based, they enable people to share visualizations and insights, and collaboratively make decisions.
Some of our valuable customers across various countries