Ubiq Reporting Software
Reporting Software for Interactive Reports & Dashboards
Turn your business data into interactive reports and dashboards with Ubiq.
Create reports using an intuitive drag-and-drop interface, analyze data from multiple sources, apply powerful filters and visualizations, and securely share insights with your team — without building a reporting system from scratch.
- Create reports & dashboards in minutes
- Build reports using drag & drop
- Analyze local, remote & cloud data
- Create real-time, interactive reports
- Share reports securely with your team
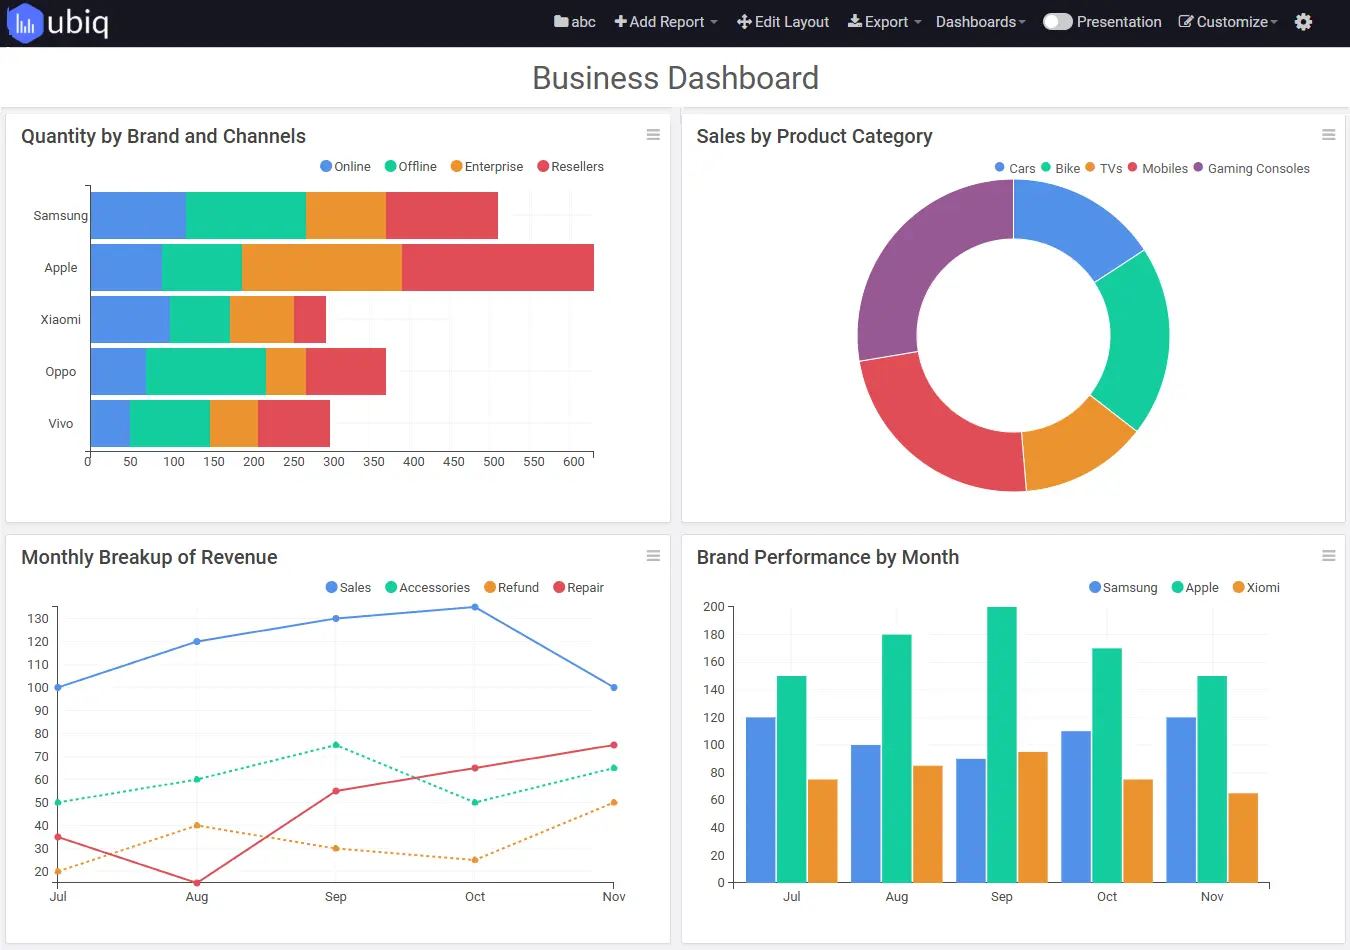
Trusted by Businesses Worldwide
Teams use Ubiq to turn business data into reports and dashboards.






Visual Report Builder
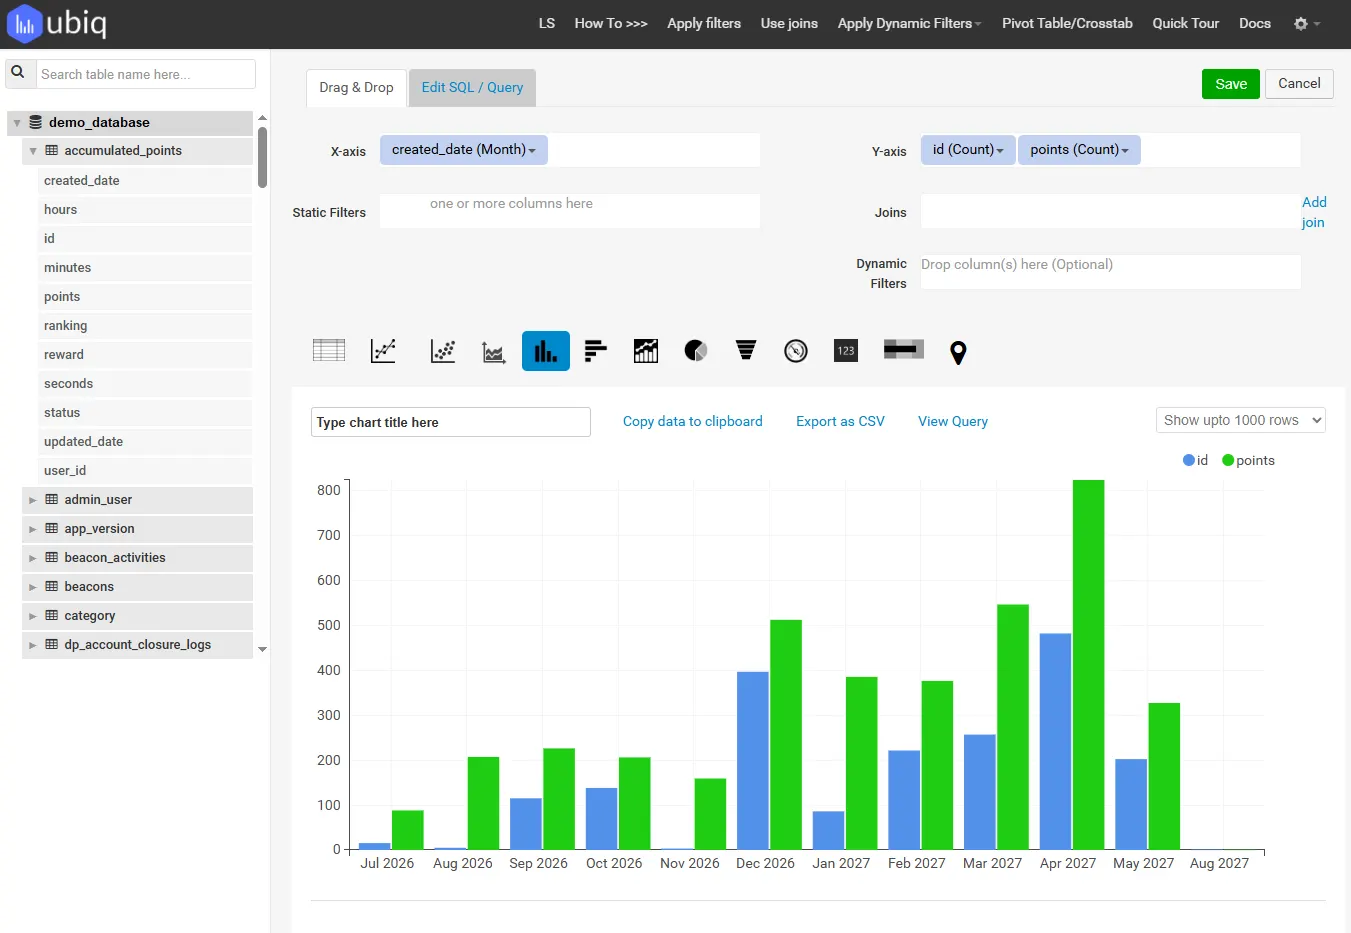
Create Reports Using Drag & Drop
Building business reports shouldn't require writing code or waiting for IT.
Ubiq provides a visual report builder that lets you turn your data into useful reports and dashboards using drag and drop. Select the data you want to analyze, choose how you want to present it, and customize your report with a few clicks.
Create tables, charts and other visualizations to present your data clearly. Apply filters, grouping, sorting and calculations to answer specific business questions.
For advanced users who prefer working directly with data, Ubiq also provides an SQL editor for creating and modifying SQL queries.
Browser-Based Reporting
Web-Based & Online Reporting Software
Create, view and manage reports directly from your web browser.
Ubiq's web-based reporting software gives your team access to business reports without installing traditional desktop reporting software. Users can build reports from their browser and access the information they need across supported devices and operating systems.
Because reports are available online, teams can work with the same reports and business information instead of maintaining separate spreadsheet copies.
Create a report once and make it available to the people who need it.
Build reports in your browser
Create and modify reports through an easy-to-use web interface.
Access reports from anywhere
View business reports without being tied to a specific desktop or workstation.
Share reports with your team
Securely make reports available to colleagues, managers and other stakeholders.
Analysis
Powerful Reporting Tools for Data Analysis
Reporting isn't simply about displaying data. It should help you understand what the data means.
Ubiq provides reporting and analysis tools that help you explore business information, identify trends and investigate the numbers behind your reports.
Create high-level reports for monitoring performance and drill down when you need to investigate the underlying information.
Reporting and analysis capabilities
- Interactive charts and visualizations
- Tables and cross-tabs
- Filters and sorting
- Grouping and aggregation
- Calculated functions
- Multi-series charts
- Search
- Parameterized queries
- User inputs
- Dynamic filters
- Drill-down analysis
- Automatic data refresh
- Scheduled Email Reports
- Export as PDF/Image
Data Visualization
Create Interactive Reports & Data Visualizations
Turn rows of business data into information people can understand.
Ubiq lets you visualize data using a variety of charts and report formats, including bar charts, column charts, line charts, pie charts, area charts, stacked charts, multi-series charts, tables and other visualizations.
Choose the visualization that best communicates the information instead of forcing every dataset into the same report format.
Use interactive filters and drill-down capabilities to move from an overview of performance to the details behind the numbers.
Database Reporting
Database Reporting Software
Turn the information stored in your databases into reports your business can actually use.
Ubiq lets you create reports directly from supported databases without repeatedly exporting your data into spreadsheets.
Business users can build reports visually using drag and drop, while technical users can use SQL when they need more control over a query.
Start Reporting Your DataReport directly from your data
Connect Ubiq to supported local, remote or cloud databases and create reports from your business data.
Build reports without SQL
Use the visual report designer to select, analyze and visualize information without having to write every query manually.
Use SQL when you need it
Advanced users can create or modify queries using the SQL editor.
Analyze multiple sources
Bring information from multiple data sources into your reporting workflow and create a more complete view of your business.
Live Business Data
Real-Time Reporting
Business decisions are more useful when they're based on current information.
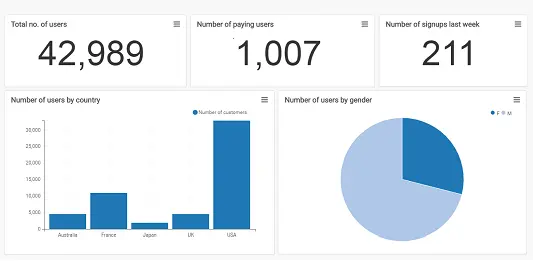
Ubiq can create web-based reports that reflect the latest information available from your connected data source. Instead of repeatedly rebuilding reports or exporting updated spreadsheets, reports can be refreshed as the underlying data changes.
Use real-time reporting to monitor important metrics, operational activity and business performance. Automatic refresh capabilities can keep frequently viewed reports up to date, while drill-down lets users investigate the details behind a metric when something changes.
Business Intelligence
BI Reporting & Business Intelligence
Go beyond static reports and use your data to understand business performance.
Ubiq combines reporting, visualization and analysis capabilities in one platform so teams can turn raw business data into useful information.
Create interactive reports and dashboards, analyze trends, monitor key performance indicators and investigate business questions without requiring every user to be a developer or data engineer.
Self-service reporting
Enable business users to answer routine data questions and create reports without relying on IT for every request.
Analyze data visually
Use charts, tables, filters and interactive reports to identify patterns and trends.
Drill down into your data
Start with a high-level business metric and explore the underlying information when you need more detail.
Bring data together
Analyze information from multiple sources to create a more complete picture of your business.
Share business insights
Make reports available to the people responsible for making decisions.
Flexible Data Access
Cloud-Based Reporting Software
Your reporting software shouldn't require your data to live on one computer.
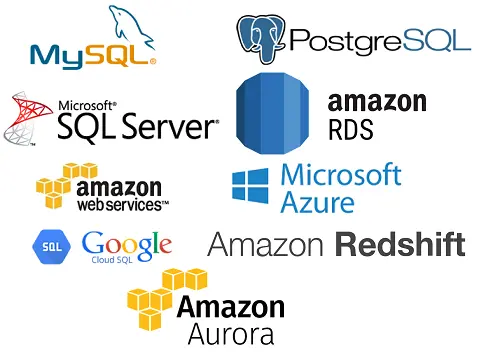
Ubiq helps you create reports from supported local, remote and cloud data sources through a web-based reporting environment.
This gives teams the flexibility to work with business data wherever it is stored while providing a common interface for creating, viewing and sharing reports.
For private networks and supported configurations, Ubiq can connect to data without requiring you to make your database publicly accessible.
Business Reporting
Create Reports for Every Area of Your Business
Different teams ask different questions, but the reporting process is fundamentally the same: connect to reliable data, turn it into useful information and make that information available to the people who need it.
Sales Reports
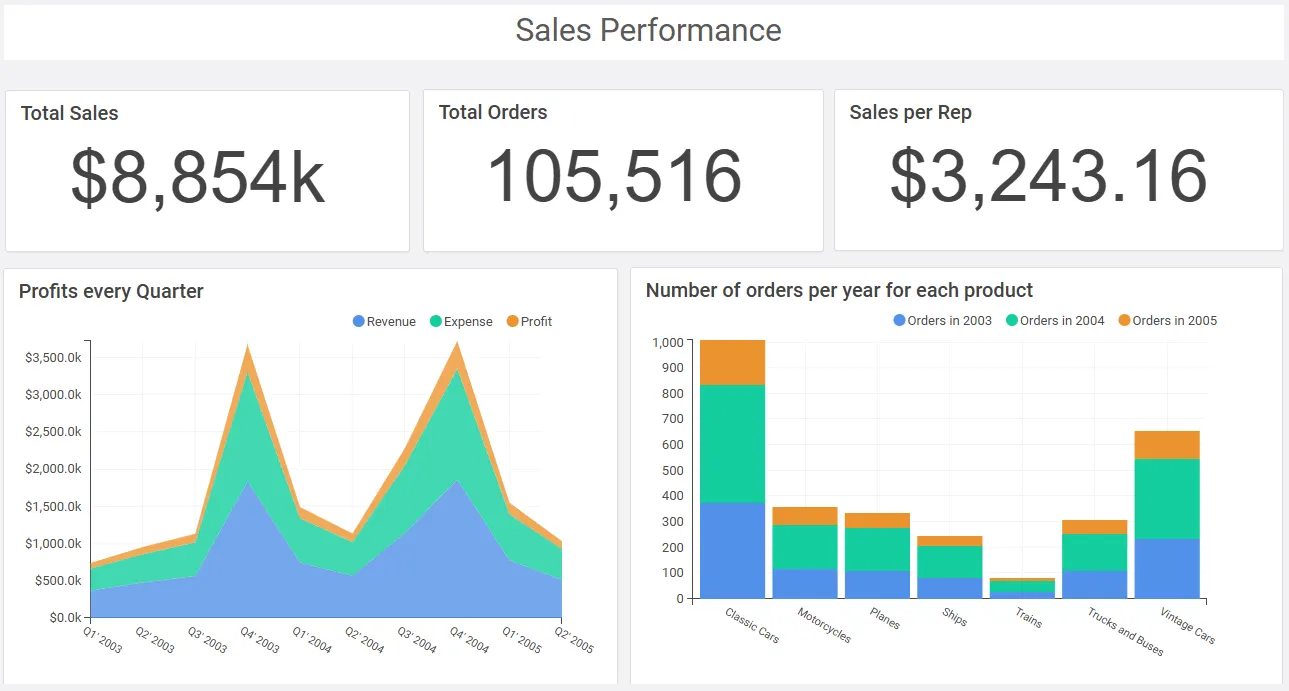
Track sales performance, revenue, products, customers and other important sales metrics. Create reports that help sales teams and managers understand performance and identify changes over time.
Marketing Reports
Analyze marketing performance using reports that bring important campaign, acquisition and customer metrics together.
Financial Reports
Create reports for financial metrics and trends so stakeholders can monitor performance and investigate changes.
Operations Reports
Monitor operational metrics and create recurring reports that help teams understand day-to-day business performance.
Management Reports
Give managers and executives high-level reports for monitoring departments, teams and important business KPIs, with the ability to drill down when more detail is required.
Customer Stories
Trusted by Teams That Rely on Their Data
See how businesses use Ubiq to make reporting and analytics faster and easier.
“Several departments use Ubiq... Looks like all departments use Ubiq. It’s our main analytics tool.”
 Ilya Arhipov
Operations Director, Esprit Games
Ilya Arhipov
Operations Director, Esprit Games
“Ubiq has given us instant access to all our data. The charts are very smart and work very well for us.”
 Mary Blount
IT Manager, MinsterSoft
Mary Blount
IT Manager, MinsterSoft
“Ubiq is a very very good and useful product. It easily saves 10x the time needed to write a query and filters.”
 Mo Ghaoui
CEO, GAMING DOT ME LLC
Mo Ghaoui
CEO, GAMING DOT ME LLC
“We have been using Ubiq for our team of 15 members for more than 2 years.”
 Fernando Gomez
IT Manager, QBE International
Fernando Gomez
IT Manager, QBE International
Reporting Workflow
From Raw Data to Business Report in Minutes
Ubiq simplifies the reporting workflow.
Connect your data
Connect Ubiq to a supported data source.
Choose what you want to report
Select the data, fields and metrics relevant to your business question.
Build your report
Use drag and drop or SQL to create the report you need.
Visualize the results
Present the information using tables, charts and other visualizations.
Analyze your data
Apply filters, calculations and drill-down to explore the information.
Share the report
Make the finished report available to your team or export it when required.
Why Ubiq
Why Use Ubiq Reporting Software?
Easy to use
Create useful reports without requiring every business user to know SQL or programming.
Flexible reporting
Build anything from a simple data report to an interactive business dashboard.
Web based
Create and access reports using a browser instead of relying on traditional desktop reporting software.
Built for business data
Turn information from your databases into reports for sales, marketing, finance, operations, management and other teams.
Powerful for advanced users
Use SQL and advanced reporting capabilities when visual report building isn't enough.
Designed for collaboration
Share business information with the people who need it instead of distributing multiple spreadsheet versions of the same report.
FAQ
Frequently Asked Questions
Turn Your Data Into Useful Business Reports
Stop spending time manually assembling reports from scattered data.
Use Ubiq to create interactive reports and dashboards, analyze business information and give your team access to the insights they need.
Start Your Free Trial