Growth Metrics & KPIs help you monitor business performance and determine if it is headed in the right direction. However, it is essential to track the right Growth KPIs to grow your business and identify issues. There are many KPIs for business growth but you must track the key Growth KPI examples that matter. Here are the top 5 Growth KPIs every business must track regularly.
Top 5 Growth KPIs Every Business Must Track Regularly
Here are the top 5 Growth KPIs every business must track regularly.
1. Revenue Growth Rate
Monitor how fast your revenue grows every week/month. Revenue Growth is one of the most important Growth KPIs. Here’s how to calculate revenue growth.
Revenue Growth % = (Current Period’s revenue/Previous Period’s revenue -1)*100

If your revenue this month is $12,000 and that of past month is $10,000 then the revenue growth rate is 20%.
Initially, track the total revenue growth over time, using a BI Reporting tool.

As your data grows over time, segment your revenue by channels and campaigns to track revenue growth in more detail.

This is also one of the key marketing metrics.
2. Number of Active Users
It’s important that your users actively use your product/service and don’t just abandon them.

Also, instead of tracking total number of users over time, it is better to track total number of active users over time.

Who is an active user? It can be someone who logs into your website at least once a week, or even once a month. It can also be someone who makes at least 1 purchase every month. Define it, depending on the nature of your business, and track this number every week/month.
If number of active users is falling every month, then it is a cause of concern. At the very least, this should remain constant, if not growing.
3. Cart Abandonment Rate/Churn Rate
If you’re an ecommerce business, it is important to track the number of users who have added items to their shopping cart but abandoned your website just before completing a purchase, also known as cart abandonment rate. A high cart abandonment rate indicates problems with the checkout experience such as lack of payment options, which needs to be worked upon.

Similarly, if you run a SaaS business, then it is essential to track the number of users who stop using your product/service every month, also known as churn rate. A high churn rate can eat into your growth and stagnate your business.
4. Average Ticket Size
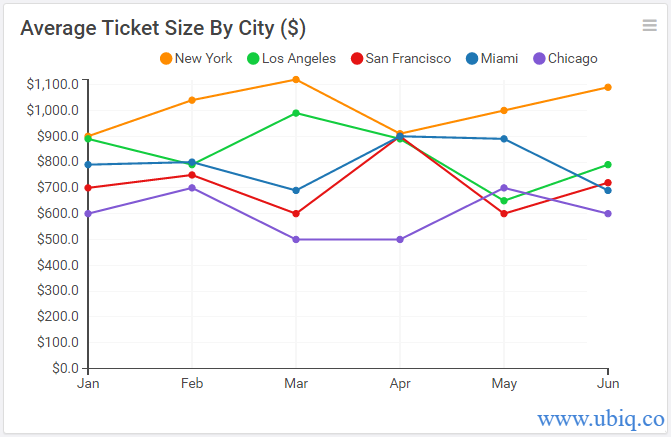
What is the average price of an ordered item on your online store? What is the average pricing plan for your SaaS product? This average ticket size gives you an idea of how much average revenue to expect from your customers.

You can track the overall ticket size, to get a sense of overall trend, as well as average revenue by customer segments, using a data visualization tool.

This will help you identify the most lucrative customer segments. Once you have identified high value customer segments, you can try upselling and cross-selling other products to them, and grow your business even further.
5. Cost of Acquisition
How much money do you have to spend to gain one customer, on an average? Calculate cost of customer acquisition by summing up all the costs your business incurs to acquire customers over a period of 1 month.
Divide this amount by the total number of customers acquired during one month.

If the average revenue per customer is not more than your cost of acquisition, then your business will run into losses very quickly. So if you have a high cost of acquisition, then it makes sense to increase the price of your product/service to make up for it.
The above-mentioned growth KPIs and metrics will give you a clear idea of whether your business is growing or not. Include them in your business dashboards and share them with your team, to get useful insights and brainstorm next steps. However, monitor them only once a week/month, and not daily. Otherwise, you will get confused by the day-to-day fluctuations that are an invariable part of every business.
Here’s a sample business growth dashboard created using Ubiq dashboard software that shows growth KPIs

If you want to create business dashboards, reports & charts, you can try Ubiq. We offer a 14-day free trial!
Sreeram Sreenivasan is the Founder of Ubiq. He has helped many Fortune 500 companies in the areas of BI & software development.