Analytics, Data Visualization tools for your business
-
✓ Create data visualizations in minutes
-
✓ Visualize data using drag & drop
-
✓ Connect to many data sources
-
✓ Share data visualizations with your team
Try ubiq for free!
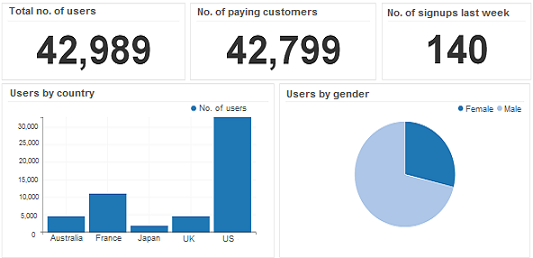

Analytics & Data Visualization Tools enable you to create data visualization, graphs and charts for your business. Create simplistic, but insightful, visualizations in minutes. If you have a project that is best served by data visualization software, then you need to choose the best data visualization tools for it. Ubiq is a fast and user-friendly software for visual data analytics. Quick to setup, this data visualization software allows you to easily visualize data. Included pre-built visualization functions and interactive dashboards further serve to lower the learning curve. Ubiq is the most comprehensive visualization tool which supports a wide variety of charts, graphs, maps and other graphics.
See how easy it is

Data visualization software makes it easy to visualize data. Ubiq is a user-friendly software with an easy-to-use drag and drop interface that can help you quickly turn your data into business insights. Because the software is accessible online, it allows your entire team to build and work with the visualization tool. Ubiq offers an online business intelligence tool that has an intuitive UI and is specifically designed to allow users to build sophisticated dashboards with no IT involvement. Ubiq's dynamic model means that you can quickly analyze your data in multiple dimensions. If you can imagine any visualization, you can do it with ubiq. It is feature packed, interactivity rich and extremely beautiful.
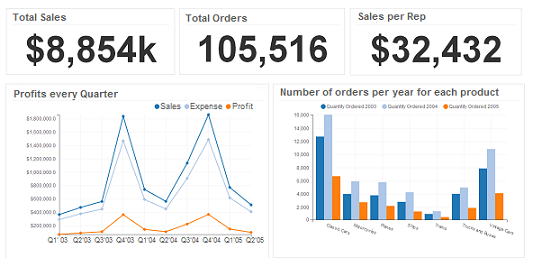
Ubiq Analytics & Visualization Tools enables you to visualize data from a variety of data source. Unlike most data analytics and visualization tools, Ubiq can connect to local or remote data of many different formats. Additionally, the Ubiq data visualization engine can connect to live data for up-to-date visualizations or warehoused data for rich insightful visualizations. Connect any database you like, you can blend multiple data sources and types to gain the exact insights you need. Ubiq is able to work with a wide variety of data sources,can combine these disparate data sources into a single visualization or dashboard. Visualizations update as data changes in sources such as databases. Share and publish data visualizations in various formats.
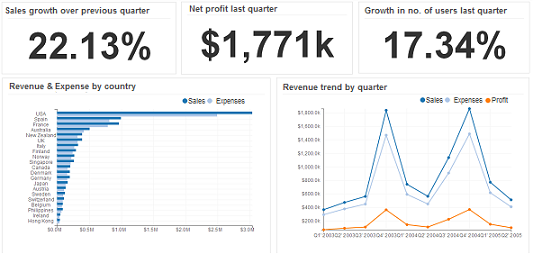
Ubiq data visualization platform enables you to quickly create data visualizations and share them with your team. You can share data visualizations online or publish them in multiple formats. It is particularly well-suited for users looking to visualize data in existing cloud-based apps, legacy systems, web services or internal databases. Created dashboards can be viewed on tablets and mobile devices in addition to a PC or laptop. Because the software is accessible online, data visualizations and charts are available to your entire organization. Put analysis capabilities in the hands of business users, not elite analytics or BI experts. Avoid hiring a data visualization specialist/agency.
Create advanced data visualizations and analytics for every area of your business - marketing, sales, operations, IT, HR, etc. Ubiq has the most exhaustive collection of charts and maps. It also provides a variety of formatting options to customize visualizations in minutes. You'll find everything you need right out of the box. We also have a nice collection of business dashboards and live demos for guidance. Our charts and maps work across all devices and platforms, are highly customizable and have beautiful interactions. The most feature-rich visualization tool which supports a wide variety of charts, graphs, maps and other graphics. Benefit from advanced visualization features including filter and search capabilities. Discover patterns and trends that aren't as apparent when presented as data in columns and rows.

Ubiq Data visualization tools provide great value for money. You can quickly analyze, explore and visualize data. You can easily share visualizations with your team and collaboratively draw insights, make better decisions faster. All this at a fraction of cost of other visualization tools. Visualization makes data-analysis easier. Analysis with more conventional BI query and analysis tools isn't so easy. Start visualizing data and driving insights in minutes. Ubiq lets you access analytics, visualizations anytime, anywhere on your laptop, tablets or mobile phones. Save time, money and man power.
Ubiq is a fast and user-friendly data visualization software for visual data analytics. Even business users can easily set it up without depending on the IT. This visualization software allows you to get started quickly. It has an easy-to-use interface that allows users to create advanced data visualizations without IT. Ubiq provides a drag and drop interface to quickly visualize data into business insights. Save weeks or even months spent in data analysis & visualizations for your organization.

Data visualization Tools provide the ability to quickly visualize your data or use a dashboard to watch for trends, patterns and outliers, and draw insights. Choosing the best data visualization tools for your organization provides competitive advantage. If you're looking for a visual analytics software with a high return-on-investment, Ubiq may be right for you. A comprehensive data visualization tool like Ubiq allows your organization to access data in real time, allowing you to quickly understand key business metrics and make decisions based on that information. Custom visual dashboards save time, improve decision making, and help save or bring in new revenue. Data visualizations enable you to build a great custom dashboard that is tailored to your company's needs. If you feel you're not getting full value from your organization's available information, it's time to unlock the business potential of your information through visual data analytics.
Some of our valuable customers across various countries