
Business Performance Dashboard Reports allow you to easily get at-a-glance status of your business, derive insights from data and make better decisions. Here’s how to create business performance dashboard reports for your organization.
What is a business performance dashboard
Business Performance Dashboard is a visual presentation of key performance indicators about an entire business, or a specific business area, department, or business process. It allows end users to get a quick overview of their department, products, processes and projects that they are responsible for. They automatically collect, analyze, and report data from various systems in the organization, making it easy for users to get important information from one place. A business performance dashboard uses charts, graphs and tables to visualize information, help users get insights quickly and make data-driven decisions.
Bonus Read : Business Intelligence Reporting Best Practices
Benefits of business performance dashboard
Here are the key benefits of business performance dashboard. Business dashboards :
- Offer single point of information
- Help users get insights quickly
- Improves productivity and efficiency
- Allows teams to monitor operational performance regularly
- Helps managers track performance against goals
- Facilitate collaboration and communication
- Are accessible from anywhere, at anytime
- Highlight issues upfront using automated alerts
- Help with predictive analytics and forecasting
Bonus Read : How to Create Executive Dashboard & Reports
How to Create Business Performance Dashboard Reports
Here are the steps to create business performance dashboards.
1. Understand Your Target Audience
The most important step to create business performance dashboard reports is to clearly understand who will use your business performance dashboard, why and how. Different people in an organization have different information requirements.
Executives may use your dashboard to evaluate strategic performance against goals, managers may need it to monitor day-to-day operations and issues.
Similarly, marketing team will look for information about various marketing campaigns while the IT department will be interested in monitoring IT infrastructure health. Once you determine your target audience, you will know what information to present in your dashboards.
Find out how frequently your end users will use your dashboard. This will help you understand how often you need to refresh the data.
Also, understand how you need to deliver these dashboards. Some users may prefer email reports, some may want mobile access, while some may want to access it via web portals.
Bonus Read : How to Create Project Management Dashboard
2. Identify KPI Metrics
Next, it is important to clearly identify the metrics & KPIs to be displayed on your dashboard. The nature of KPI metrics changes with the organization role of your audience.
For example, executives will be looking for high-level summary metrics while analysts will be looking for granular details. Understand what metrics your audience wants in your dashboard, so you can deliver them and make your dashboards more relevant.
3. Design Dashboards
Lastly, before you create business performance dashboard reports, it is important to organize your KPI metrics in an intuitive dashboard layout so that end users can easily get insights from data. Arrange KPI metrics in 3 layers – the most important and urgent ones at the top, trends, comparisons and distributions in the middle and granular data at the bottom.
Group related KPI metrics by placing them near each other. This will help users easily make comparisons and draw insights.
Share these mock ups with key stakeholders and key decision makers, and get a sign off so that you can freeze the dashboard designs.
Bonus Read : HR Dashboards & Reports – Benefits, Examples, KPIs & Metrics
Business Performance Dashboard examples & templates
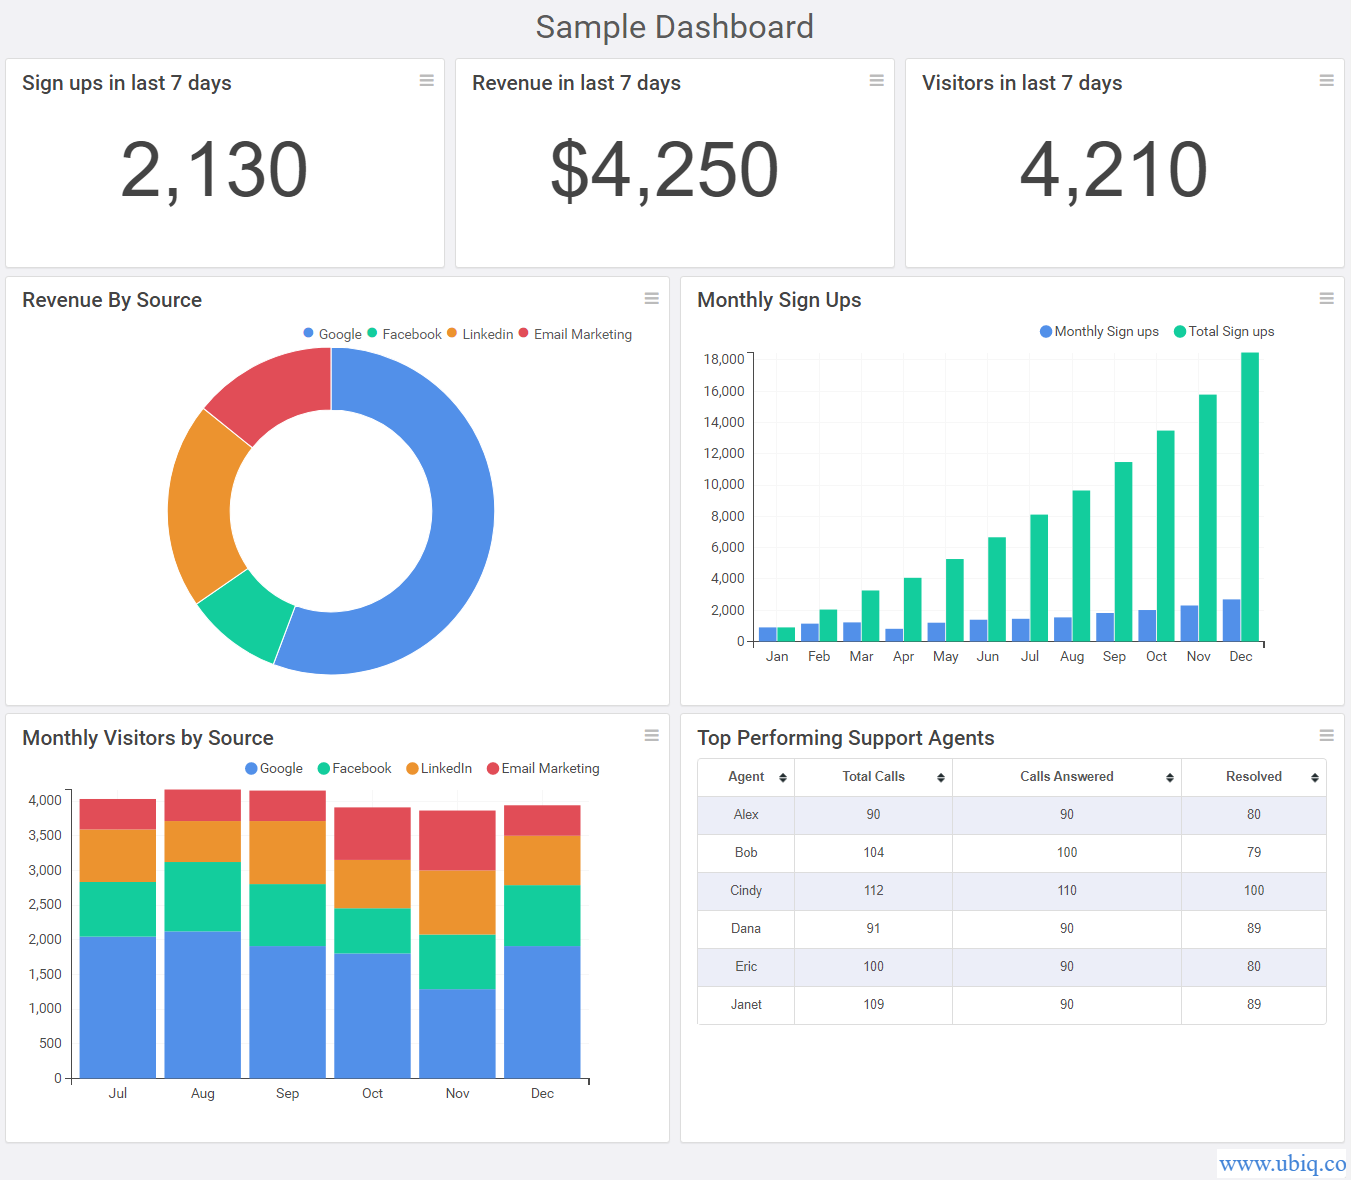
You can use a dashboard software to easily create business performance dashboard reports for your business. Here’s an example of business performance dashboard built using Ubiq.
Hopefully, this article will help you create business performance dashboard reports for your organization.
Ubiq makes it easy to visualize data in minutes, and monitor in real-time dashboards. Try it Today!